Market Wrap: Stocks, Bonds, Commodities
The dollar fell to a more than one-year low against the euro and sterling on Thursday after data showed employers added 818,000 fewer jobs in the year to March than previously thought.
The Dow Jones Industrial Average rose 55.52 points to 40,890.49, the S&P 500 gain 0.42% to 5,620.85 and the Nasdaq Composite ascend 0.57 points to 17,918.99.
MSCI’s index of Asia-Pacific stocks outside Japan is down 0.10% to 703.81 levels. The Australian index was higher by 0.21% to 8,027.00. Japanese Nikkei Index increase 0.67% today.
European stocks were mixed on Thursday, with the Stoxx Europe 50 Index increase 0.31% to 4,900.45, Germany’s DAX ascend 0.27% to 18,502.25, and France’s CAC higher 0.36% to 7,552.13 and U.K.’s FTSE 100 gain 0.23% to 8,302.48.
Benchmark 10-year U.S. Treasury rose as demand for safe assets slipped again, today 10-year bond yields 1.03% to 3.8170.
Oil prices fell for a fifth session on Thursday as investors worried about the global demand outlook, despite a decline in U.S. fuel inventories.
Spot Brent crude oil increase 0.08% to $76.11 per barrel. US West Texas Intermediate crude is decrease 0.06% to $71.89 a barrel.
The yellow metal gold is down 0.30% to 5,539.00 dollars per ounce.
Market Wrap: Forex
The U.S. dollar has had a difficult summer so far, and Capital Economics sees more downside over the next couple of years, citing unfavorable rate differentials and continued robust risk appetite.
Today, the U.S. dollar index measures the Greenback against a trade-weighted basket of six major currencies, which increase 0.21% to 101.190.
The Euro US Dollar (EUR/USD) is a widely traded pair that is increase 0.00% today. This left the pair trading around $1.11510.
The Japanese yen was will move positive against the U.S. dollar on Tuesday. Today USD/JPY is trades pair that increase 0.21% to the 145.560 level.
Another commodity-related currency positive against the U.S dollar, AUD/USD gain 0.16% to 0.67530 , and NZD/USD increase 0.21% to 0.61690 level.
EUR/USD Intraday: Trend on the upside
Our pivot point is at 1.11470
Preferable Price Action: Take buy positions above pivot level with targets at 1.11795 & 1.12080 in extension.
Alternative Price Action: Sell pivot looks for a further downside to 1.11120 & 1.10830.
Comment: RSI is above 50 levels and Pairs above its 20MA & 55MA.
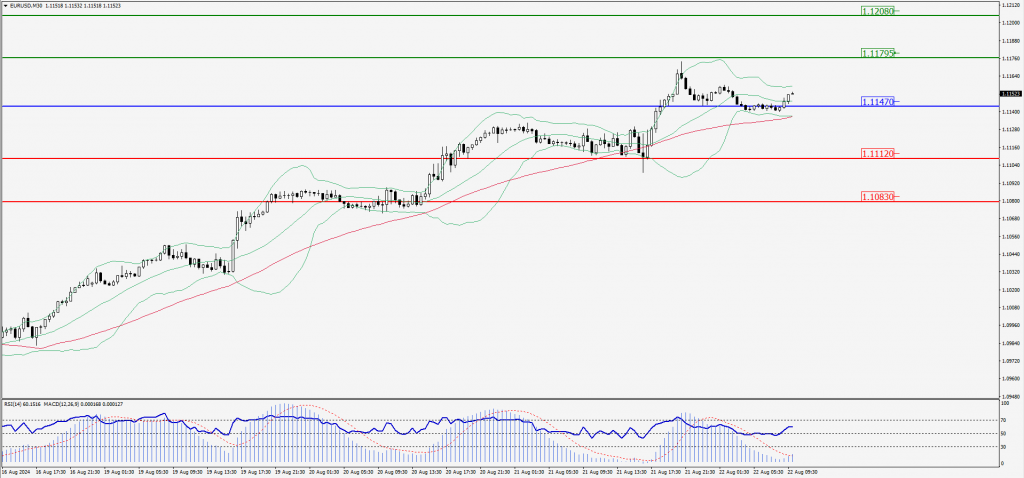
Green Lines Indicate Resistance Levels – Red Lines Indicate Support Levels
Light Blue is a Pivot Point – Black represents the price when the report was produced
GBP/USD Intraday: Trend on the upside
Our pivot point is at 1.30810
Preferable Price Action: Buy positions above pivot with targets at 1.31190 & 1.31540 in extension.
Alternative Price Action: The price below pivot would call for further downside to 1.30430 & 1.30090.
Comment: RSI is above 50 levels and Pairs above its 55MA.
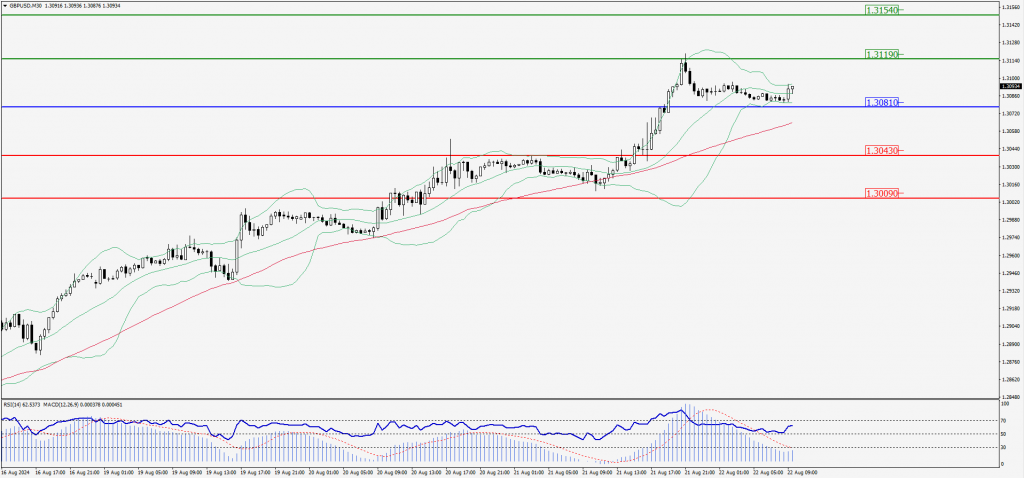
Green Lines Indicate Resistance Levels – Red Lines Indicate Support Levels
Light Blue is a Pivot Point – Black represents the price when the report was produced
USD/JPY Intraday: Trend on the upside
Our pivot point is at 145.270
Preferable Price Action: Sell position below pivot with the target at 145.990 and 146.590 in extension.
Alternative Price Action: The downside breakout of the pivot would call for 144.500 and 143.880.
Comment: MACD is above 50 levels and Pairs above its 20MA.
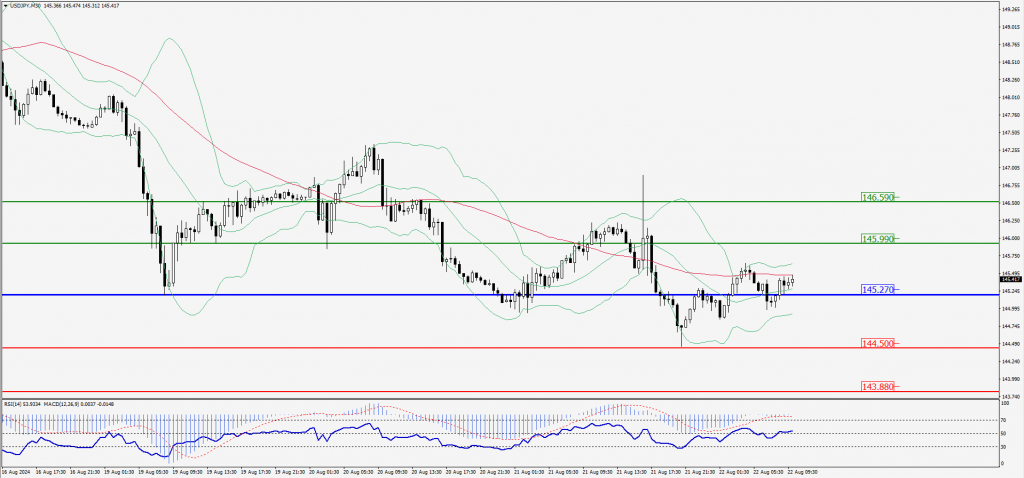
Green Lines Indicate Resistance Levels – Red Lines Indicate Support Levels
Light Blue is a Pivot Point – Black represents the price when the report was produced
AUD/USD Intraday: Trend on the upside
Our pivot point is at 0.67390
Preferable Price Action: Buy positions above pivot with targets at 0.67590 & 0.67765 in extension.
Alternative Price Action: Below pivot a further downside with 0.67180 & 0.67000 as targets.
Comment: RSI is above 50 levels and pairs above its 55MA.
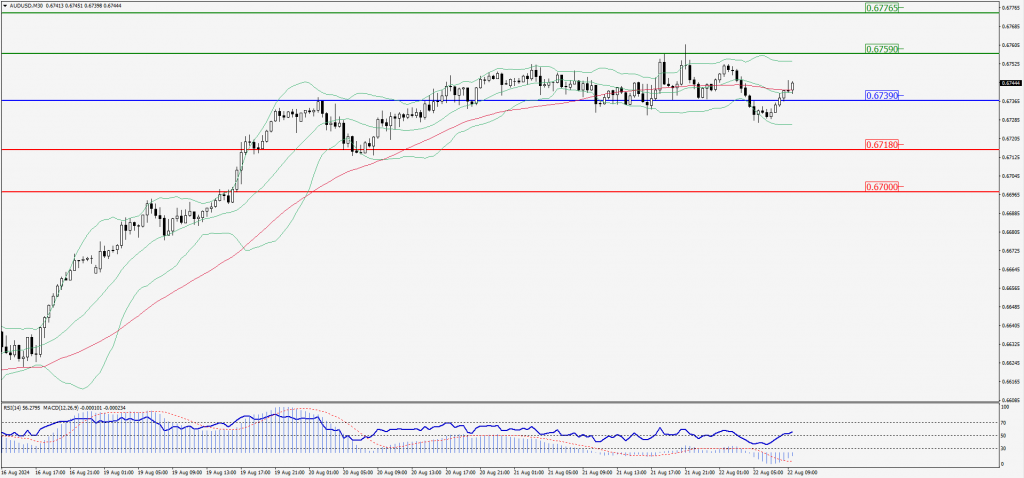
Green Lines Indicate Resistance Levels – Red Lines Indicate Support Levels
Light Blue is a Pivot Point – Black represents the price when the report was produced
CRUDEOIL Intraday: Trend on the downside
Our pivot point is at 72.25
Preferable Price Action: Below pivot sell oil with 70.91 & 69.79 as targets.
Alternative Price Action: Buy crude above pivot with targets at 73.61 and 74.66 in extension.
Comment: RSI is at 50 levels and pairs below its 55MA.
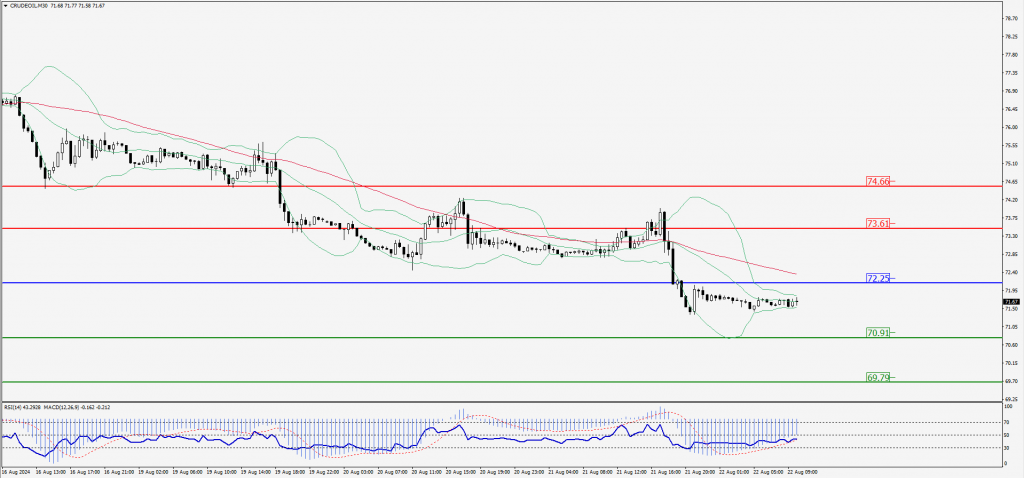
Green Lines Indicate Resistance Levels – Red Lines Indicate Support Levels
Light Blue is a Pivot Point – Black represents the price when the report was produced
XAU/USD Intraday: Trend on the downside
Our pivot point is at 2509.40
Preferable Price Action: Further downside to 2497.50 and 2487.70.
Alternative Price Action: If the price gives an upside breakout of a pivot, then the price extends to 2521.25 and 2531.40.
Comment: MACD is below 50 levels and pairs below its 20MA.
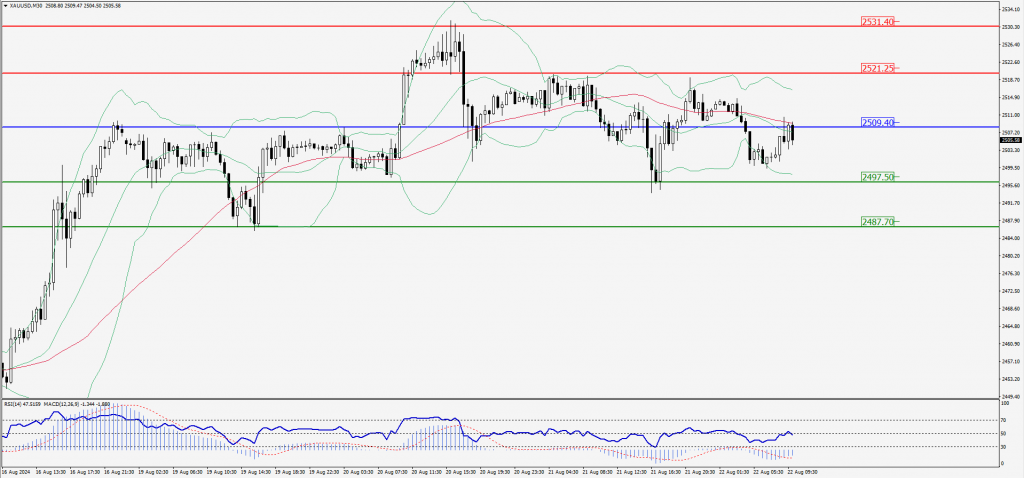
Green Lines Indicate Resistance Levels – Red Lines Indicate Support Levels
Light Blue is a Pivot Point – Black represents the price when the report was produced
Dow Jones Intraday: Trend on the upside
Our pivot point is 40,906.80
Preferable Price Action: Take buy positions above the pivot with targets at 40,972.40 & 41,029.10.
Alternative Price Action: Below 40,906.80 looks for further downside to 40,836.80 & 40,775.60.
Comment: RSI is above 50 levels and pairs above its 20MA & 55MA.
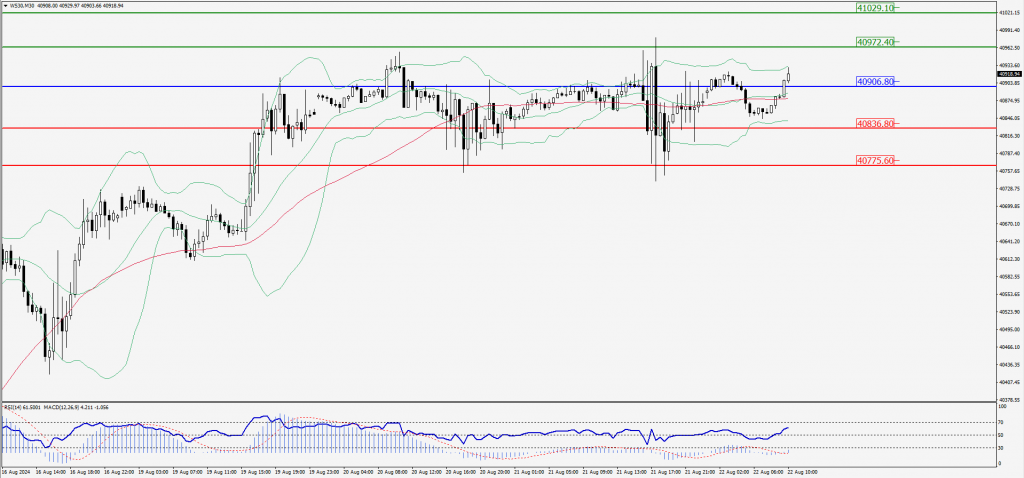
Green Lines Indicate Resistance Levels – Red Lines Indicate Support Levels
Light Blue is a Pivot Point – Black represents the price when the report was produced