Market Wrap: Stocks, Bonds, Commodities
The dollar slipped to its lowest this year versus the euro on Wednesday as traders braced for potentially crucial revisions to U.S. payrolls data later in the day, ahead of a speech by Federal Reserve Chair Jerome Powell at the end of the week.
The Dow Jones Industrial Average fell 61.56 points to 40,834.97, the S&P 500 loss 0.20% to 5,597.12 and the Nasdaq Composite descend 59.83 points to 17,816.94.
MSCI’s index of Asia-Pacific stocks outside Japan is down 0.50% to 701.05 levels. The Australian index was higher by 0.16% to 8,010.50. Japanese Nikkei Index decrease 0.35% today.
European stocks were mixed on Wednesday, with the Stoxx Europe 50 Index increase 0.11% to 4,874.85, Germany’s DAX ascend 0.39% to 18,426.15, and France’s CAC higher 0.31% to 7,508.76and U.K.’s FTSE 100 gain 0.24% to 8,293.25.
Benchmark 10-year U.S. Treasury rose as demand for safe assets slipped again, today 10-year bond yields 0.05% to 3.8170.
Oil prices edged lower on Wednesday as Israel accepting a proposal to tackle disagreements blocking a ceasefire deal in Gaza eased supply concerns and China’s economic weakness weighed on the demand outlook.
Spot Brent crude oil increase 0.63% to $77.69 per barrel. US West Texas Intermediate crude is increase 0.60% to $73.61 a barrel.
The yellow metal gold is down 0.26% to 2,543.90 dollars per ounce.
Market Wrap: Forex
The U.S. dollar edged higher in early European trade Wednesday, but remains close to seven-month lows as minutes from the last Federal Reserve meeting and likely revisions to payrolls data are set to point to an interest rate cut in September.
Today, the U.S. dollar index measures the Greenback against a trade-weighted basket of six major currencies, which increase 0.10% to 101.540.
The Euro US Dollar (EUR/USD) is a widely traded pair that is decrease 0.10% today. This left the pair trading around $1.11190.
The Japanese yen was will move positive against the U.S. dollar on Tuesday. Today USD/JPY is trades pair that increase 0.60% to the 146.120 level.
Another commodity-related currency nagative against the U.S dollar, AUD/USD loss 0.01% to 0.67400, and NZD/USD decrease 0.20% to 0.61390 level.
EUR/USD Intraday: Trend on the upside
Our pivot point is at 1.11170
Preferable Price Action: Take buy positions above pivot level with targets at 1.11360 & 1.11530 in extension.
Alternative Price Action: Sell pivot looks for a further downside to 1.10950 & 1.10750.
Comment: RSI is above 50 levels and Pairs above its 55MA.
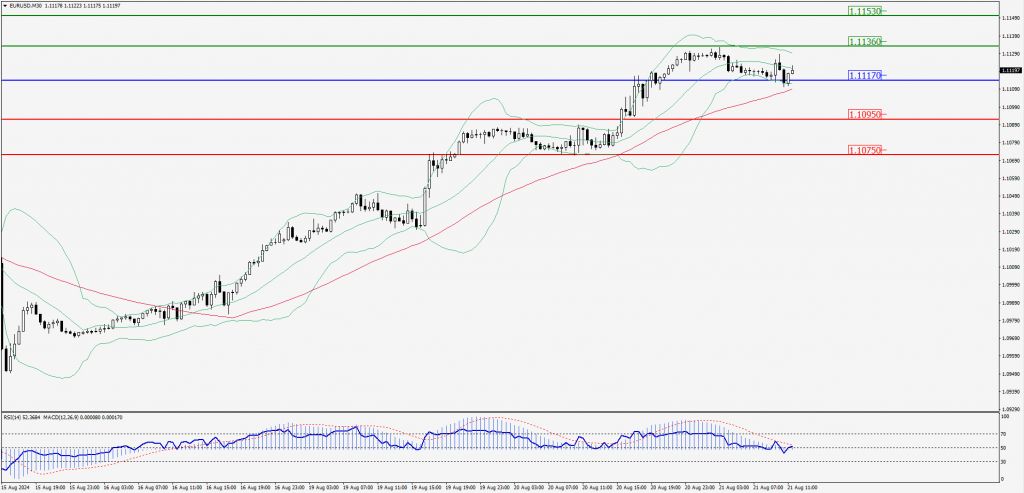
Green Lines Indicate Resistance Levels – Red Lines Indicate Support Levels
Light Blue is a Pivot Point – Black represents the price when the report was produced
GBP/USD Intraday: Trend on the downside
Our pivot point is at 1.30320
Preferable Price Action: Buy positions above pivot with targets at 1.30020 & 1.29770 in extension.
Alternative Price Action: The price below pivot would call for further downside to 1.30600 & 1.30830.
Comment: RSI is above 50 levels and Pairs above its 20MA.
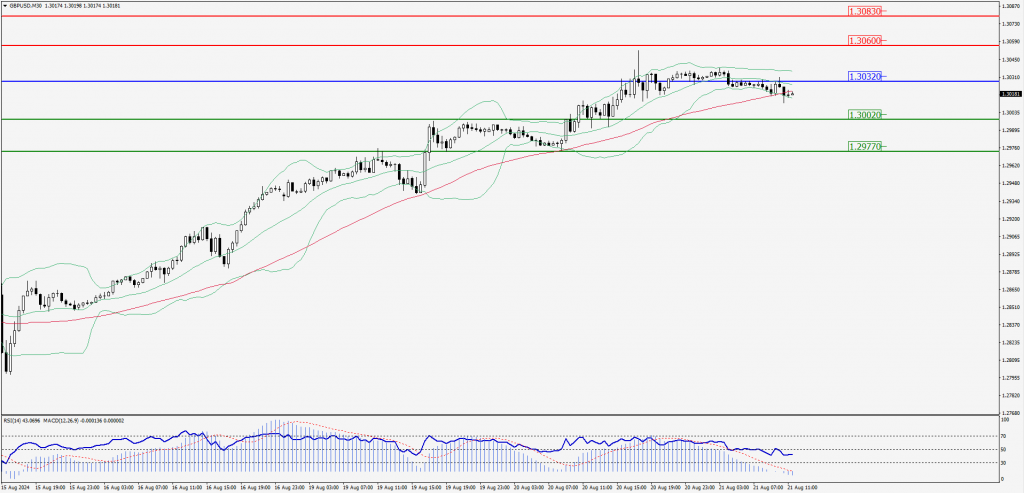
Green Lines Indicate Resistance Levels – Red Lines Indicate Support Levels
Light Blue is a Pivot Point – Black represents the price when the report was produced
USD/JPY Intraday: Trend on the upside
Our pivot point is at 145.990
Preferable Price Action: Sell position below pivot with the target at 146.420 and 146.830 in extension.
Alternative Price Action: The upside breakout of the pivot would call for 145.510 and 145.110.
Comment: MACD is below 50 levels and Pairs below its 20MA and 55MA.
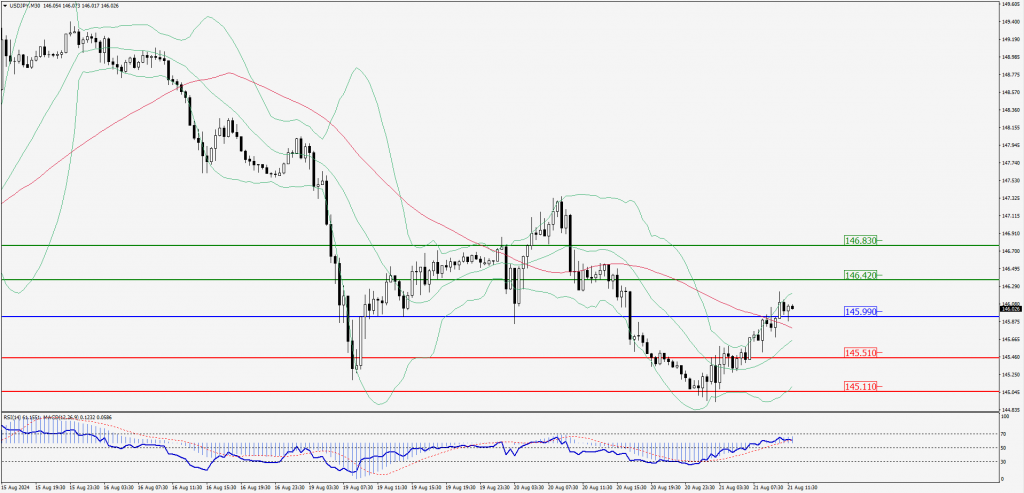
Green Lines Indicate Resistance Levels – Red Lines Indicate Support Levels
Light Blue is a Pivot Point – Black represents the price when the report was produced
AUD/USD Intraday: Trend on the downside
Our pivot point is at 0.67440
Preferable Price Action: Sell positions below pivot with targets at 0.67290 & 0.67140 in extension.
Alternative Price Action: Above pivot a further upside with 0.67600 & 0.67730 as targets.
Comment: RSI is below 50 levels and pairs below its 20MA.
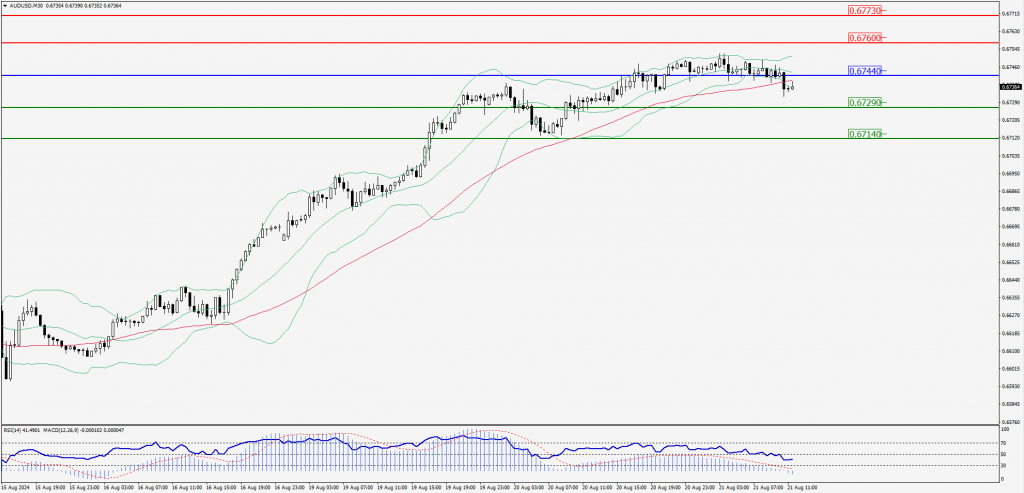
Green Lines Indicate Resistance Levels – Red Lines Indicate Support Levels
Light Blue is a Pivot Point – Black represents the price when the report was produced
CRUDEOIL Intraday: In consolidation state at 73.32
Our pivot point is at 73.32
Preferable Price Action: Below pivot sell oil with 72.77 & 72.28 as targets.
Alternative Price Action: Buy crude above pivot with targets at 73.89 and 74.53 in extension.
Comment: RSI is at 50 levels and pairs below its 55MA.
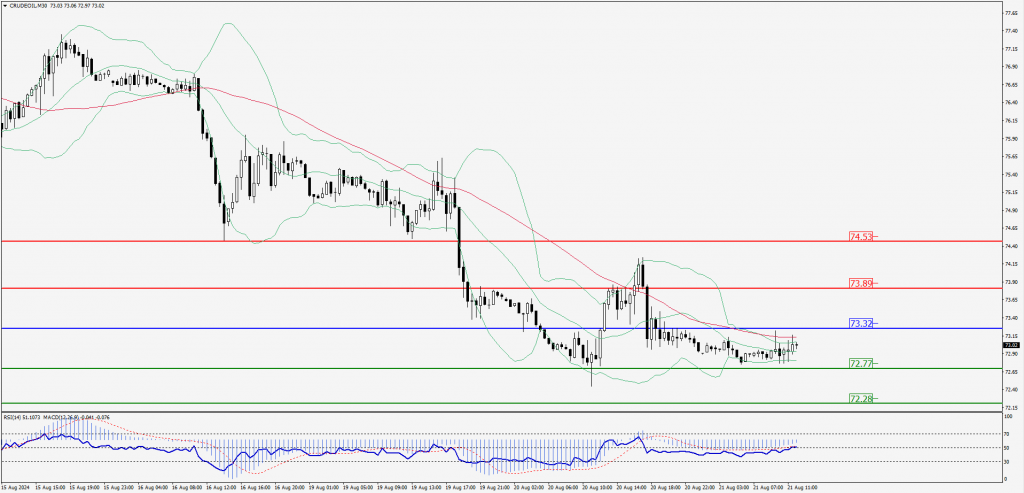
Green Lines Indicate Resistance Levels – Red Lines Indicate Support Levels
Light Blue is a Pivot Point – Black represents the price when the report was produced
XAU/USD Intraday: Trend on the downside
Our pivot point is at 2513.00
Preferable Price Action: Further downside to 2501.70 and 2492.50.
Alternative Price Action: If the price gives an upside breakout of a pivot, then the price extends to 2523.90 and 2532.70.
Comment: MACD is below 50 levels and pairs below its 20MA & 55MA.
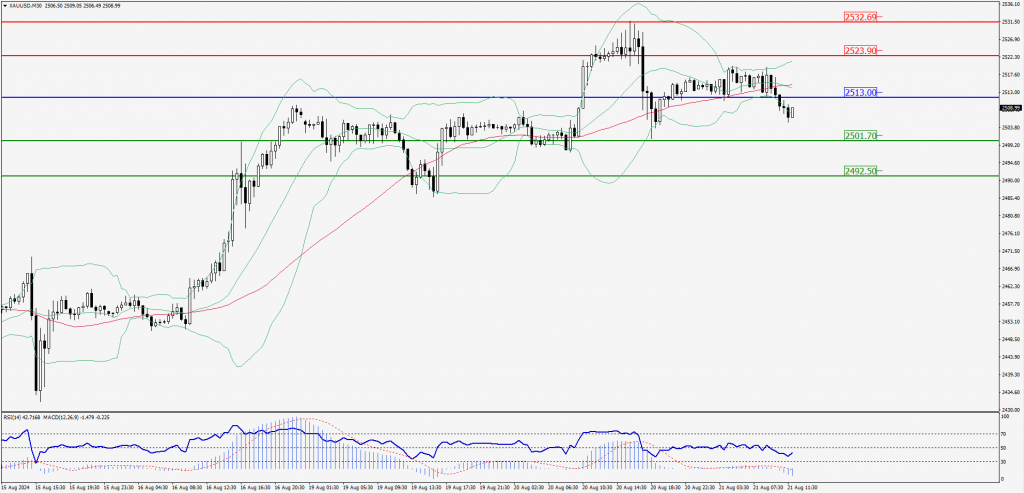
Green Lines Indicate Resistance Levels – Red Lines Indicate Support Levels
Light Blue is a Pivot Point – Black represents the price when the report was produced
Dow Jones Intraday: Trend on the upside
Our pivot point is 40,858.30
Preferable Price Action: Take buy positions above the pivot with targets at 40,958.90 & 41,037.40.
Alternative Price Action: Below 40,858.30 looks for further downside to 40,759.10 & 40,665.80.
Comment: RSI is above 50 levels.
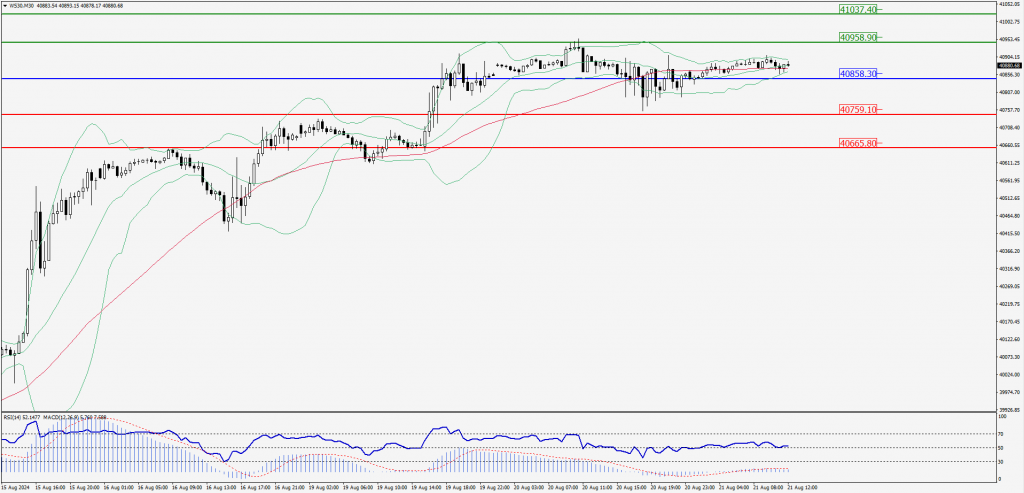
Green Lines Indicate Resistance Levels – Red Lines Indicate Support Levels
Light Blue is a Pivot Point – Black represents the price when the report was produced