Market Wrap: Stocks, Bonds, Commodities
Wall Street fell in a broad sell-off on Monday, with the S&P 500 and Nasdaq suffering their biggest daily percentage drops since May, as fear of contagion from the potential collapse of China’s Evergrande drove investors out of equities in a flight for safety.
The Dow Jones Industrial Average fell 614.41 points (1.78%) to 33,970.47, the S&P 500 lost 75.26 points (1.70%) to 4,357.73 and the Nasdaq Composite dropped 330.07 points (2.19%) to 14,713.90.
Global stock markets on Tuesday were caught in the grip of contagion fears sparked by troubles at China Evergrande as growing risks the property giant could default on its massive debt prompted investors to flee riskier assets.
MSCI’s index of Asia-Pacific stocks outside Japan lost 0.30% to 803.27 levels. Australian index gained 0.35% to 7,273.80. Japanese market plunged 2.13% to 29,850.50.
European stocks were lower on Monday, with the Stoxx Europe 50 Index down 1.77% to 4,057.25, Germany’s DAX fell 2.02% to 15,177.10, and France’s CAC lost 1.77% to 6,454.02, and U.K.’s FTSE 100 slipped 1.21% to 6,879.94.
Benchmark 10-year U.S. Treasury rose as demand for safe assets grows again, today 10-year bond yields surged 1.56% to 1.329.
Oil prices fell 2% on Monday as investors grew more risk-averse, which hurt stock markets and boosted the U.S. dollar, making oil more expensive for holders of other currencies
Spot Brent crude oil rose 1.24% to $74.84 per barrel. US West Texas Intermediate crude advance 1.34% to $71.08 a barrel.
The yellow metal traded lower 0.10% to 1762.05 dollars per ounce.
Market Wrap: Forex
The offshore yuan wallowed near an almost one-month low on Tuesday while the safe-haven dollar and yen stood tall as investors sought shelter from a potential China Evergrande default.
Today, the U.S. dollar index measures the greenback against a trade-weighted basket of six major currencies, which slipped 0.11% to 93.155.
The Euro US Dollar (EUR/USD) is a widely traded pair that up 0.06% today. This left the pairing trading around $1.17310.
The Japanese yen fell against the U.S. dollar on Tuesday as the stock pushes lower. Today US/JPY rose 0.15%to 109.550 level.
Another commodity-related currency higher against the U.S dollar, AUD/USD gained 0.32% to 0.72730, and NZD/USD rose 0.06% to 0.70260 level.
EUR/USD Intraday: Price may reverse from here
Our pivot point is at 1.17160
Preferable Price Action: Take long positions above pivot level with targets at 1.17660 & 1.17960 in extension.
Alternative Price Action: Below pivot looks for a further downside to 1.16670 & 1.16370.
Comment: Pair above its 55MA & 20MA and RSI above 50 levels.
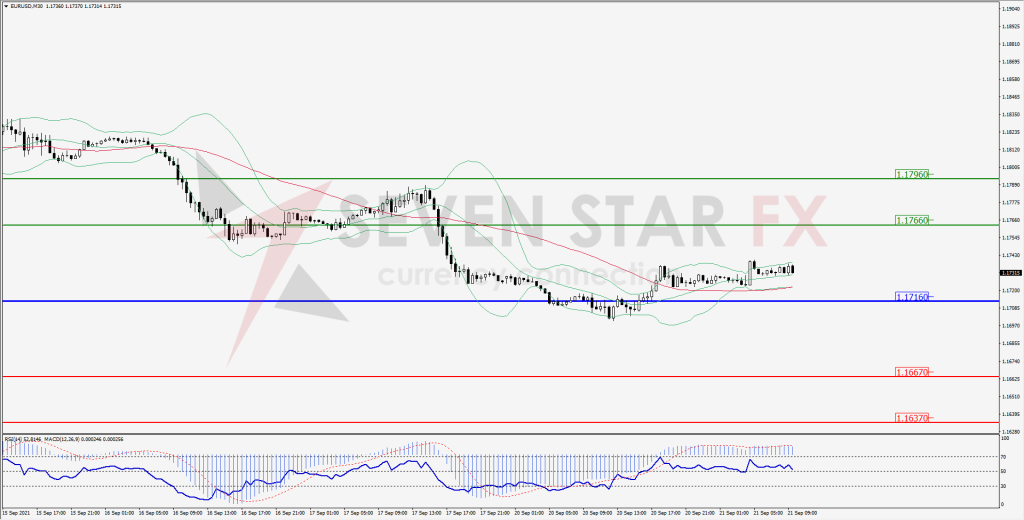
Green Lines Indicate Resistance Levels – Red Lines Indicates Support Levels
Light Blue is a Pivot Point – Black represents the price when the report was produced
GBP/USD Intraday: Trend on the downside
Our pivot point is at 1.37200
Preferable Price Action: Sell positions below pivot with targets at 1.36450 & 1.36030 in extension.
Alternative Price Action: The price above pivot would call for further upside to 1.38040 & 1.38400.
Comment: Pair above its 55MA & 20MA and RSI at 50 levels.
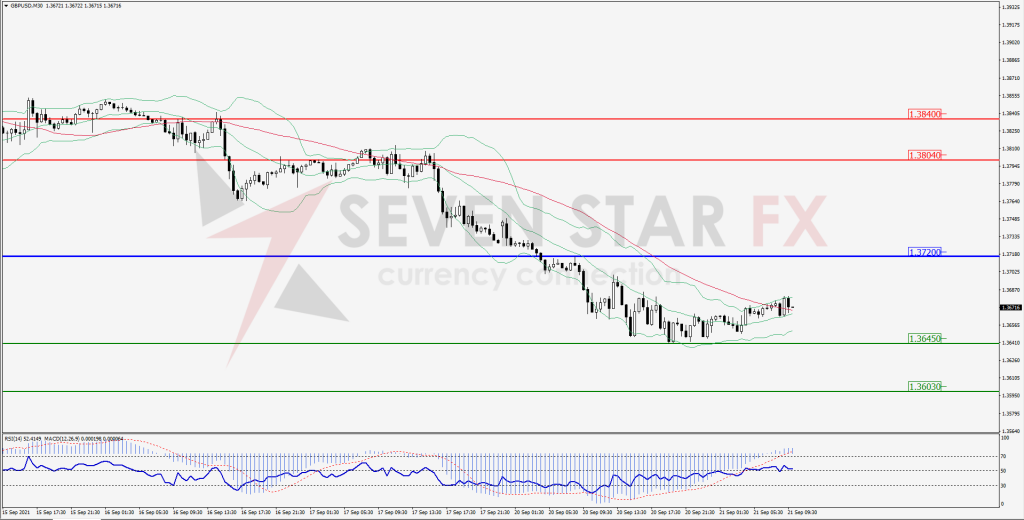
Green Lines Indicate Resistance Levels – Red Lines Indicates Support Levels
Light Blue is a Pivot Point – Black represents the price when the report was produced
USD/JPY Intraday: Support at 109.380
Our pivot point is at 109.380
Preferable Price Action: Buy position above pivot with the target at 109.990 and 110.350 in extension.
Alternative Price Action: The downside breakout of the pivot would call for 108.770 and 108.410.
Comment: Price above its 55MA & 20MA and MACD in positive territory.
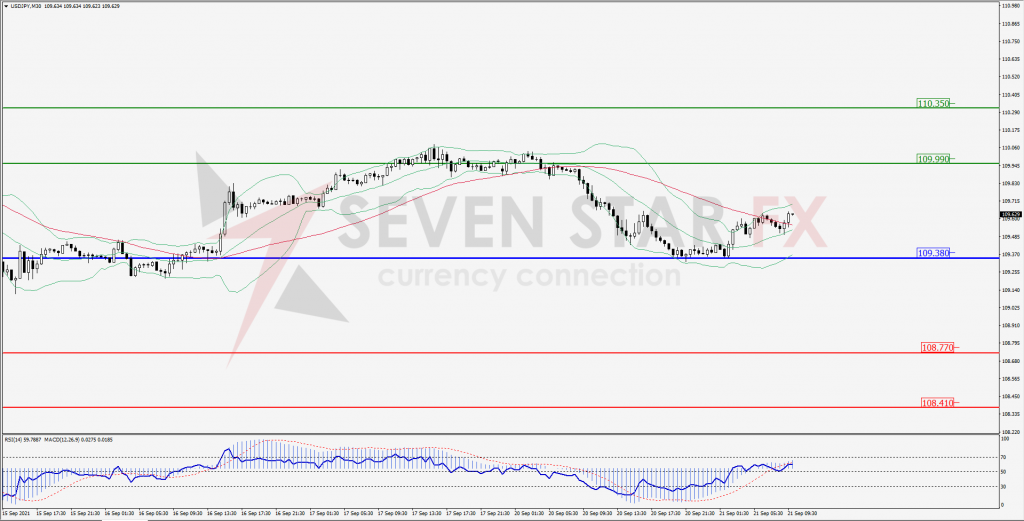
Green Lines Indicate Resistance Levels – Red Lines Indicates Support Levels
Light Blue is a Pivot Point – Black represents the price when the report was produced
AUD/USD Intraday: Support at 0.72520
Our pivot point is at 0.72520
Preferable Price Action: Buy Positions above pivot with targets at 0.73020 & 0.73280 in extension.
Alternative Price Action: Below pivot looks for a further downside with 0.72040 & 0.71770 as targets.
Comment: Pair above its 55MA & 20MA and RSI above 50 levels.
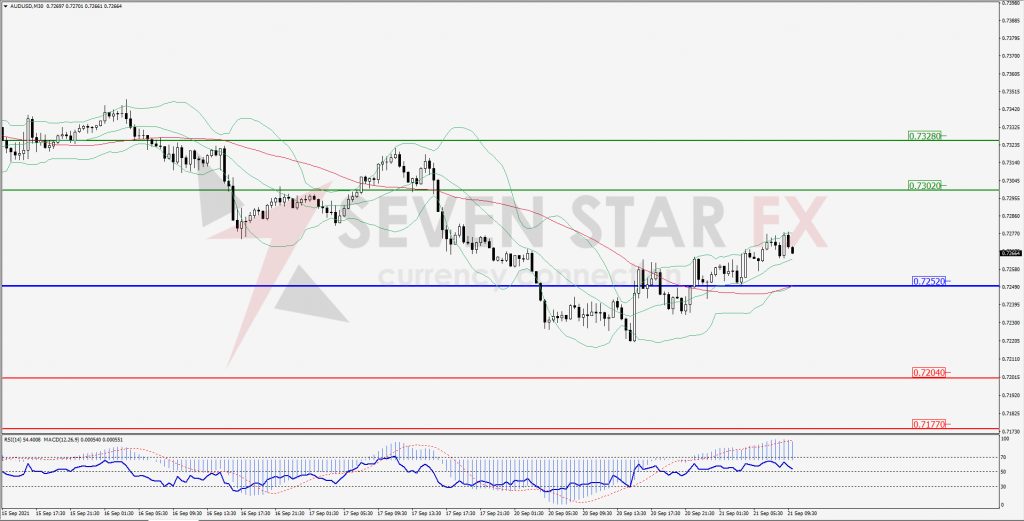
Green Lines Indicate Resistance Levels – Red Lines Indicates Support Levels
Light Blue is a Pivot Point – Black represents the price when the report was produced
CRUDEOIL Intraday: Price may reverse to the upside
Our pivot point is at 70.38
Preferable Price Action: Above pivots buy Oil with 71.50 & 72.14 as targets.
Alternative Price Action: Sell crude below pivot with targets at 69.28 and 68.65 in extension.
Comment: Crude is above its 55MA & 20MA and MACD in the positive territory.
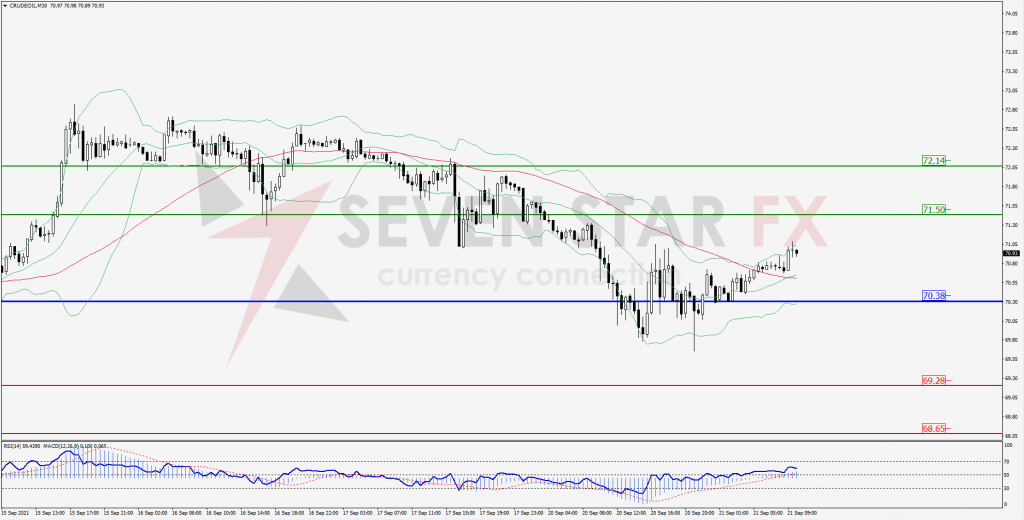
Green Lines Indicate Resistance Levels – Red Lines Indicates Support Levels
Light Blue is a Pivot Point – Black represents the price when the report was produced
XAU/USD Intraday: Resistance at 1768.30
Our pivot point is 1768.30
Preferable Price Action: Further downside to 1751.90 and 1744.80.
Alternative Price Action: If the price gives an upside breakout of a pivot, then the price extends to 1784.60 and 1791.60.
Comment: MACD in negative territory and price below its 20MA.
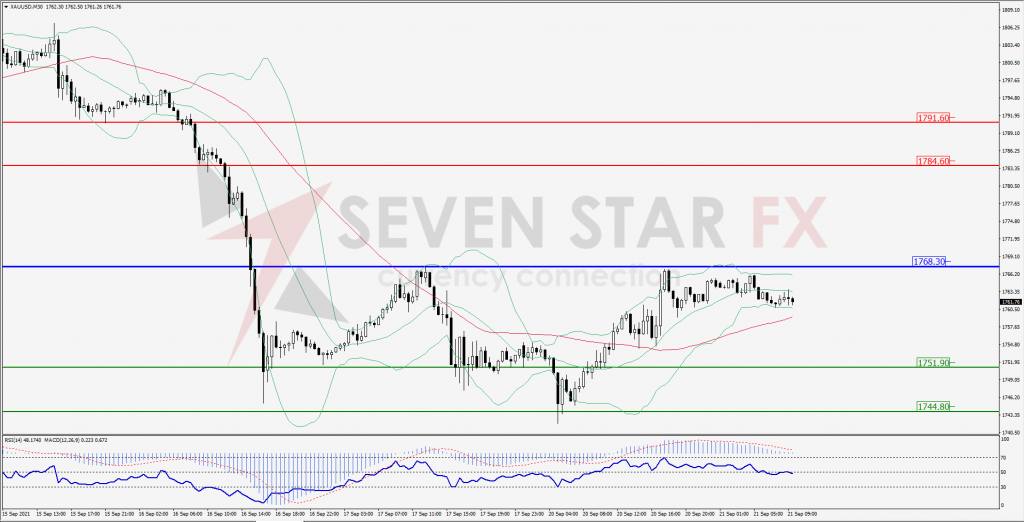
Green Lines Indicate Resistance Levels – Red Lines Indicates Support Levels
Light Blue is a Pivot Point – Black represents the price when the report was produced
Dow Jones Intraday: Break resistance level
Our pivot point is 34,036.00
Preferable Price Action: Take long positions above pivot with targets at 34,441.00 & 34,618.00.
Alternative Price Action: Below 34,036.00 looks for further downside to 33,638.00 & 33,465.00.
Comment: Price above it 55MA & 20MA and RSI above 50 levels.
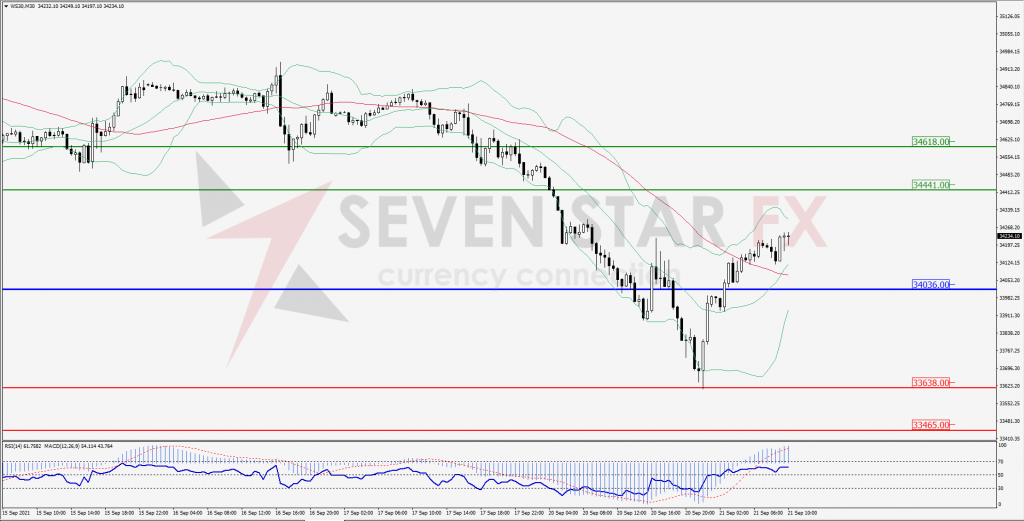
Green Lines Indicate Resistance Levels – Red Lines Indicates Support Levels
Light Blue is a Pivot Point – Black represents the price when the report was produced