Market Wrap: Stocks, Bonds, Commodities
US stocks ended sharply lower in a broad sell-off on Friday, ending a week buffeted by strong economic data, corporate tax hike worries, the Delta COVID variant, and possible shifts in the US Federal Reserve’s timeline for tapering asset purchases.
The Dow Jones Industrial Average fell 166.44 points (0.48%) to 34,584.88; the S&P 500 lost 40.76 points (0.91%) at 4,432.99; and the Nasdaq Composite dropped 137.96 points (0.91%) to 15,043.97.
Asian shares eased and the dollar held firm on Monday ahead of a week graced with no less than a dozen central bank meetings, highlighted by the Federal Reserve which is likely to take another step toward tapering.
MSCI’s index of Asia-Pacific stocks outside Japan lost 1.54% to 806.90 levels. Australian index plunged 2.10% to 7,248.70. Japanese market closed today.
European stocks were lower on Monday, with the Stoxx Europe 50 Index down 1.77% to 4,057.25, Germany’s DAX fell 2.02% to 15,177.10, and France’s CAC lost 1.77% to 6,454.02, and U.K.’s FTSE 100 slipped 1.21% to 6,879.94.
Benchmark 10-year U.S. Treasury rose as demand for safe assets grows again, today 10-year bond yields plunged 1.72% to 1.346.
Oil prices fell on Monday, extending losses from Friday after the US dollar jumped to a three-week high and the U.S. rig count rose, although nearly a quarter of US Gulf of Mexico output remained offline in the wake of two hurricanes.
Spot Brent crude oil fell 0.98% to $74.60 per barrel. US West Texas Intermediate crude lost 1.21% to $70.95 a barrel.
The yellow metal traded higher 0.06% to 1752.45 dollars per ounce.
Market Wrap: Forex
The dollar rallied to a month-high on Monday as looming catastrophe at indebted developer China Evergrande added extra nerves to a cautious mood, with investors bracing for the Federal Reserve to take another step towards tapering this week.
Today, the U.S. dollar index measures the greenback against a trade-weighted basket of six major currencies, which gained 0.18% to 93.345.
The Euro US Dollar (EUR/USD) is a widely traded pair that fell 0.12% today. This left the pairing trading around $1.17100.
The Japanese yen rose against the U.S. dollar on Monday as the stock pushes lower. Today US/JPY fell 0.15%to 109.790 level.
Another commodity-related currency lower against the U.S dollar, AUD/USD declined 0.36% to 0.72370, and NZD/USD fell 0.16% to 0.70270 level.
EUR/USD Intraday: Strong trend on the downside
Our pivot point is at 1.17390
Preferable Price Action: Take short positions below pivot level with targets at 1.16890 & 1.16620 in extension.
Alternative Price Action: Above pivot looks for a further upside to 1.17890 & 1.18170.
Comment: Pair below its 55MA & 20MA and RSI below 50 levels.
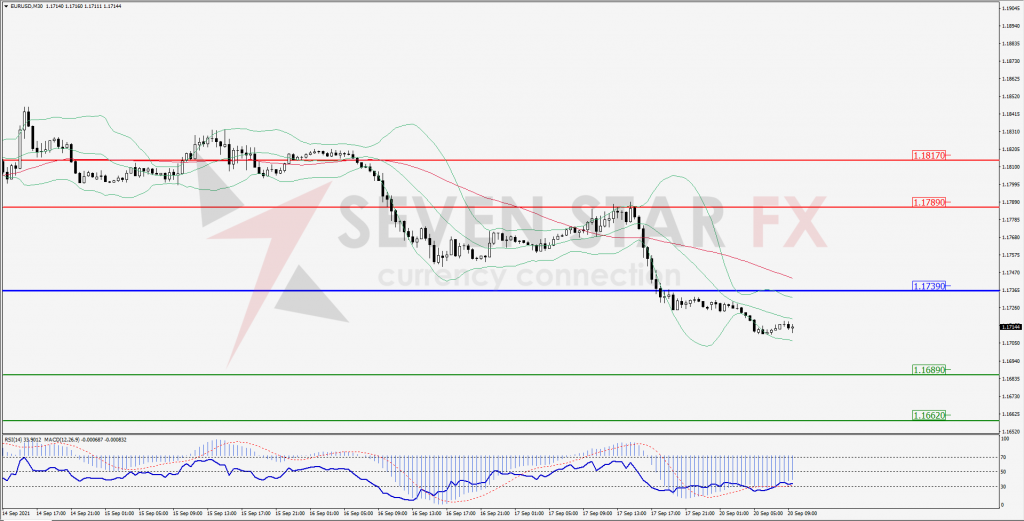
Green Lines Indicate Resistance Levels – Red Lines Indicates Support Levels
Light Blue is a Pivot Point – Black represents the price when the report was produced
GBP/USD Intraday: Trend on the downside
Our pivot point is at 1.37470
Preferable Price Action: Sell positions below pivot with targets at 1.36690 & 1.36270 in extension.
Alternative Price Action: The price above pivot would call for further upside to 1.38220 & 1.38660.
Comment: Pair below its 55MA & 20MA and RSI at oversold levels.
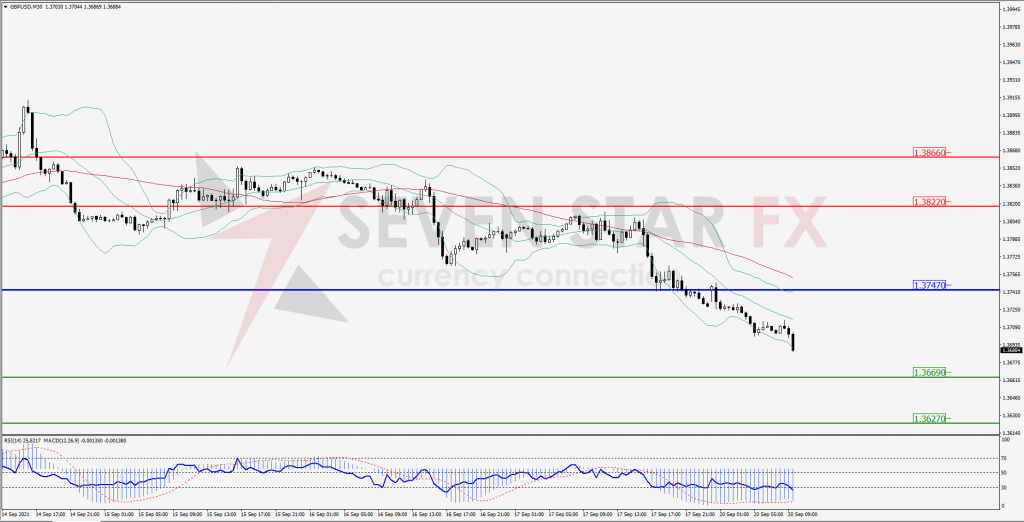
Green Lines Indicate Resistance Levels – Red Lines Indicates Support Levels
Light Blue is a Pivot Point – Black represents the price when the report was produced
USD/JPY Intraday: Trend on the upside
Our pivot point is at 109.700
Preferable Price Action: Buy position above pivot with the target at 110.110 and 110.340 in extension.
Alternative Price Action: The downside breakout of the pivot would call for 109.290 and 109.050.
Comment: Price below its 55MA & 20MA and MACD in positive territory.
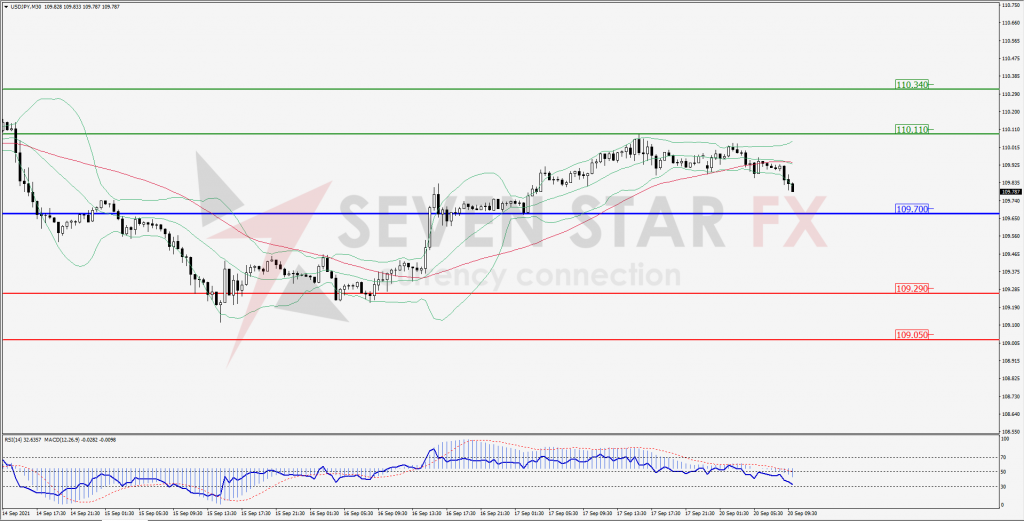
Green Lines Indicate Resistance Levels – Red Lines Indicates Support Levels
Light Blue is a Pivot Point – Black represents the price when the report was produced
AUD/USD Intraday: Resistance at 0.72680
Our pivot point is at 0.72680
Preferable Price Action: Sell Positions below pivot with targets at 0.72070 & 0.71790 in extension.
Alternative Price Action: Above pivot looks for a further upside with 0.73240 & 0.73520 as targets.
Comment: Pair below its 55MA & 20MA and RSI below 50 levels.
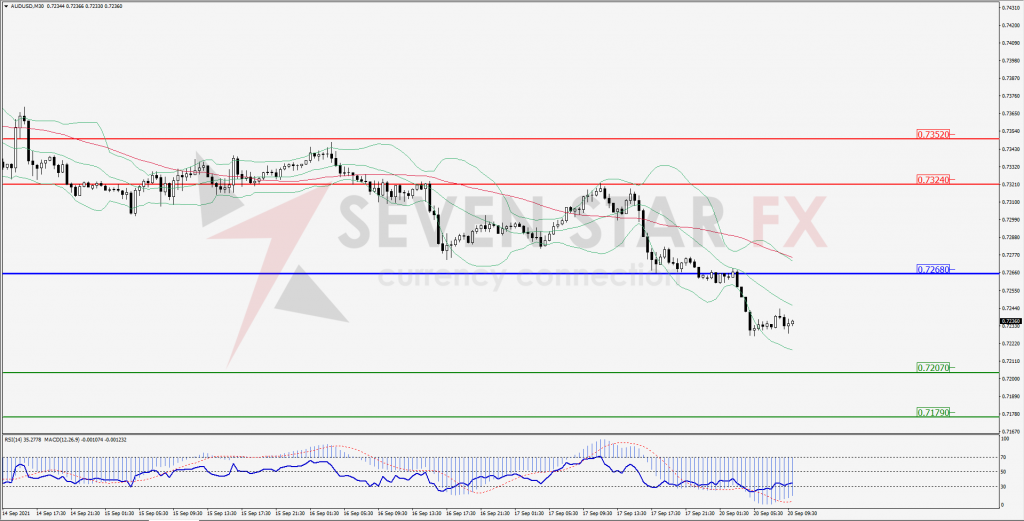
Green Lines Indicate Resistance Levels – Red Lines Indicates Support Levels
Light Blue is a Pivot Point – Black represents the price when the report was produced
CRUDEOIL Intraday: Resistance at 71.72
Our pivot point is at 71.72
Preferable Price Action: Below pivots sell Oil with 70.22 & 69.53 as targets.
Alternative Price Action: Buy crude above pivot with targets at 73.15 and 73.75 in extension.
Comment: Crude is below its 55MA & 20MA and MACD in the negative territory.
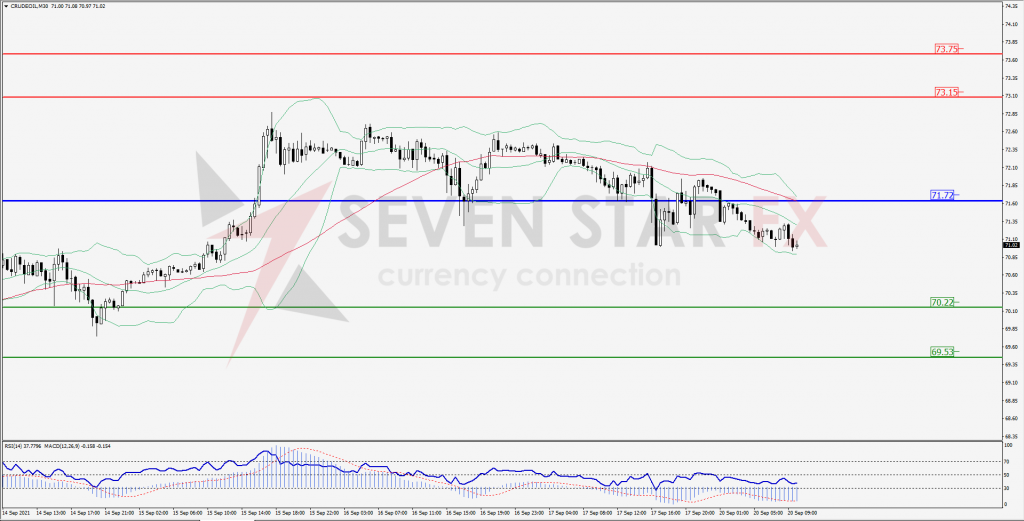
Green Lines Indicate Resistance Levels – Red Lines Indicates Support Levels
Light Blue is a Pivot Point – Black represents the price when the report was produced
XAU/USD Intraday: Trend on the downside
Our pivot point is 1766.80
Preferable Price Action: Further downside to 1744.60 and 1733.00.
Alternative Price Action: If the price gives an upside breakout of a pivot, then the price extends to 1789.30 and 1799.70.
Comment: MACD in negative territory and price below its 55MA.
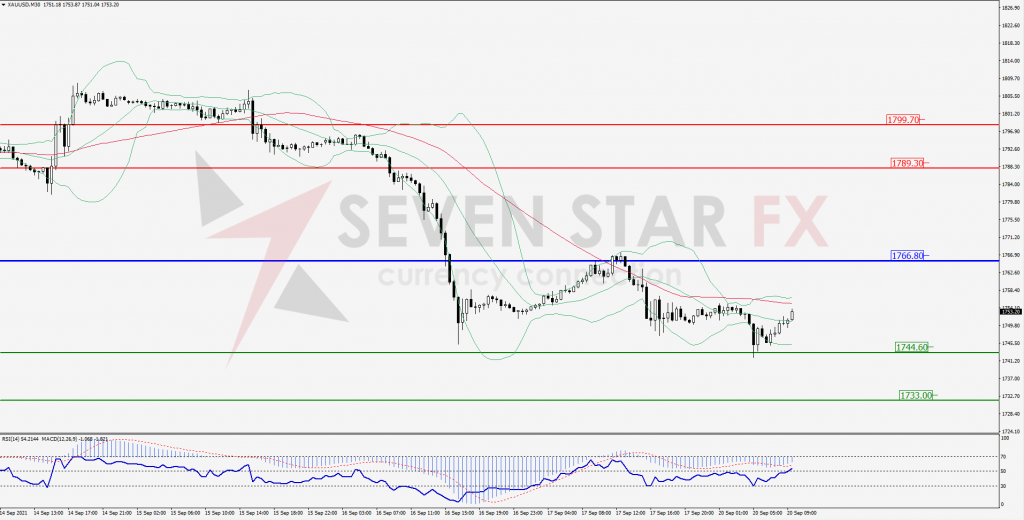
Green Lines Indicate Resistance Levels – Red Lines Indicates Support Levels
Light Blue is a Pivot Point – Black represents the price when the report was produced
Dow Jones Intraday: Break support level
Our pivot point is 34,442.00
Preferable Price Action: Take short positions below pivot with targets at 33,997.00 & 33,815.00.
Alternative Price Action: Above 34,442.00 looks for further upside to 34,841.00 & 35,042.00.
Comment: Price below it 55MA & 20MA and RSI below 50 levels.
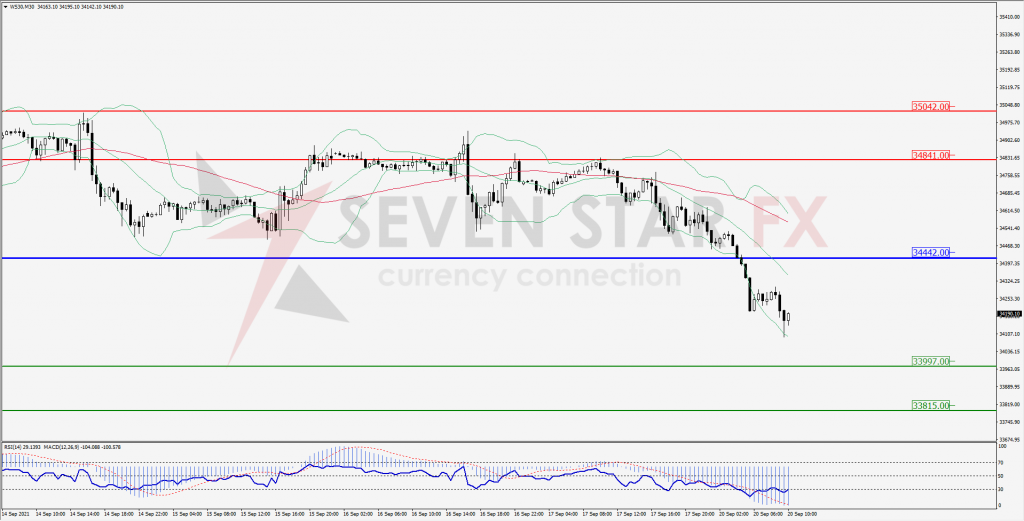
Green Lines Indicate Resistance Levels – Red Lines Indicates Support Levels
Light Blue is a Pivot Point – Black represents the price when the report was produced