Market Wrap: Stocks, Bonds, Commodities
A rebound on Wall Street fizzled on Friday as investors lost the conviction that an early rally had legs, with the Nasdaq falling more than 1 percent.
The S&P 500 Lost (1.10%) to end at 4,482.73 points, while the Nasdaq Composite fell 186.2 points (1.30%) to 14,154.00. The Dow Jones Industrial fell (0.89%) to 34,715.39.
MSCI’s index of Asia-Pacific stocks outside Japan is down 0.65%, to 796.99 levels. Australian index drop 2.27% to 7,175.80. Japanese Nikkei Index lost 1.11% to 27,522.26.
European stocks were negative on Friday, with the Stoxx Europe 50 Index fell 1.51% to 4,234.55 Germany’s DAX stair down 1.51% to 15,672.84, and France’s CAC fell 1.46% to 7,088.99, and U.K.’s FTSE 100 pulled down 0.96% to 7,512.06.
Benchmark 10-year U.S. Treasury ascend as demand for safe assets gains again, today 10-year bond yields lost to 2.59% to 1.786.
crude oil prices hitting fresh seven-year highs to rekindled fears of inflation and higher interest rates.
Spot Brent crude oil lost 1.84% to $86.75 per barrel. US West Texas Intermediate crude up 1.99% to $83.85 a barrel.
The yellow metal gold drops 0.62% to 1,831.10 dollars per ounce.
Market Wrap: Forex
The dollar was down on Friday morning in Asia. Fears that inflation will remain high and that the U.S. Federal Reserve will tighten its monetary policy soured investor sentiment, driving gains for the safe-haven Japanese yen vis-a-vis the riskier Australian dollar.
Today, the U.S. dollar index measures the greenback against a trade-weighted basket of six major currencies, which is dripped at 95.670.
The Euro US Dollar (EUR/USD) is a widely traded pair that is gained today. This left the pair trading around $1.13360.
The Japanese yen was not strong against the U.S. dollar on Friday as the stock pulled lower. Today USD/JPY is down to 0.13% at 113.940 level.
Another commodity-related currency negative against the U.S dollar, AUD/USD dropped 0.57% to 0.71840, and NZD/USD fell 0.65% to 0.67100 level.
EUR/USD Intraday: Trend on the Upside
Our pivot point is at 1.13240
Preferable Price Action: Take Long positions above pivot level with targets at 1.13450 & 1.13620 in extension.
Alternative Price Action: Below pivot looks for a further Downside to 1.13030 & 1.12860.
Comment: Pair Above 20MA and RSI above 50 levels.
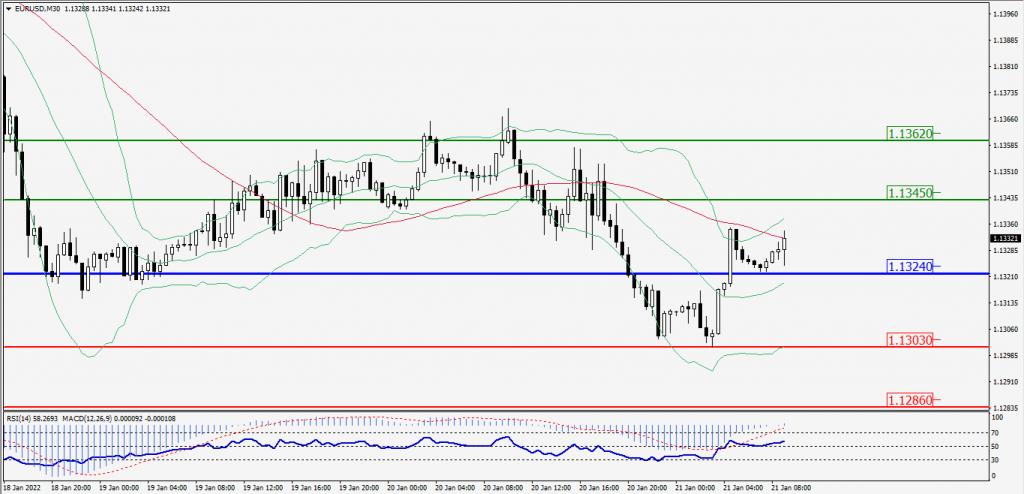
Green Lines Indicate Resistance Levels – Red Lines Indicates Support Levels
Light Blue is a Pivot Point – Black represents the price when the report was produced
GBP/USD Intraday: Major Resistance at 1.36120
Our pivot point is at 1.36120
Preferable Price Action: Sell positions Below pivot with targets at 1.35590 & 1.35160 in extension.
Alternative Price Action: The price Above pivot would call for further Upside to 1.36650 & 1.37080.
Comment: Pair Below its 20MA & 55MA and RSI below 50 levels.
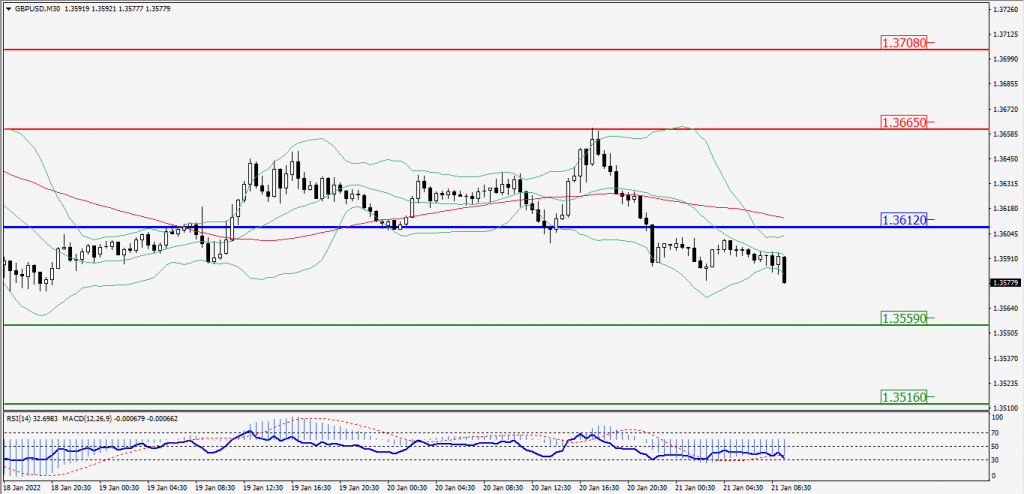
Green Lines Indicate Resistance Levels – Red Lines Indicates Support Levels
Light Blue is a Pivot Point – Black represents the price when the report was produced
USD/JPY Intraday: Trend on the Downside
Our pivot point is at 114.080
Preferable Price Action: Sell position Below pivot with the target at 113.580 and 113.190 in extension.
Alternative Price Action: The Upside breakout of the pivot would call for 114.580 and 114.970.
Comment: Pair Below 55MA and MACD in negative territory.
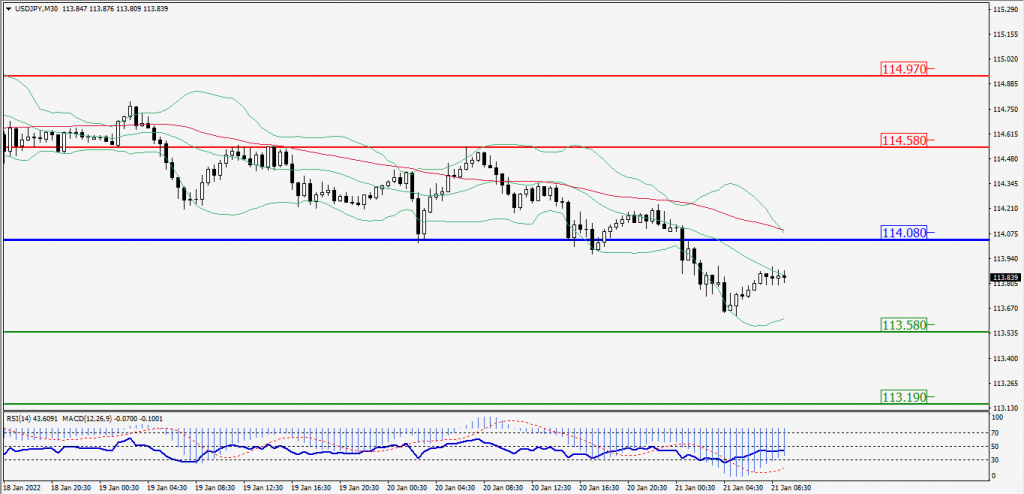
Green Lines Indicate Resistance Levels – Red Lines Indicates Support Levels
Light Blue is a Pivot Point – Black represents the price when the report was produced
AUD/USD Intraday: Trend on the Downside
Our pivot point is at 0.72170
Preferable Price Action: Sell Positions below pivot with targets at 0.71750 & 0.71430 in extension.
Alternative Price Action: Above pivot looks for a further Upside with 0.72590 & 0.72910 as targets.
Comment: Pair Below its 55MA & 20MA and RSI below 50 levels.
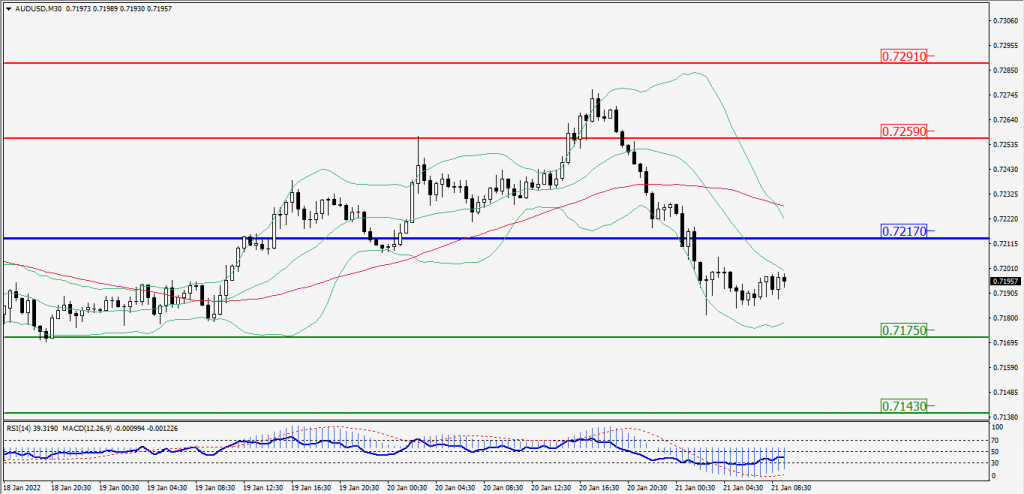
Green Lines Indicate Resistance Levels – Red Lines Indicates Support Levels
Light Blue is a Pivot Point – Black represents the price when the report was produced
CRUDEOIL Intraday: Major Resistance at 84.55
Our pivot point is at 84.55
Preferable Price Action: Below pivots Sell Oil with 83.15 & 82.10 as targets.
Alternative Price Action: Buy crude Above pivot with targets at 85.95 and 87.00 in extension.
Comment: Price Below 55MA and MACD is in the negative territory.
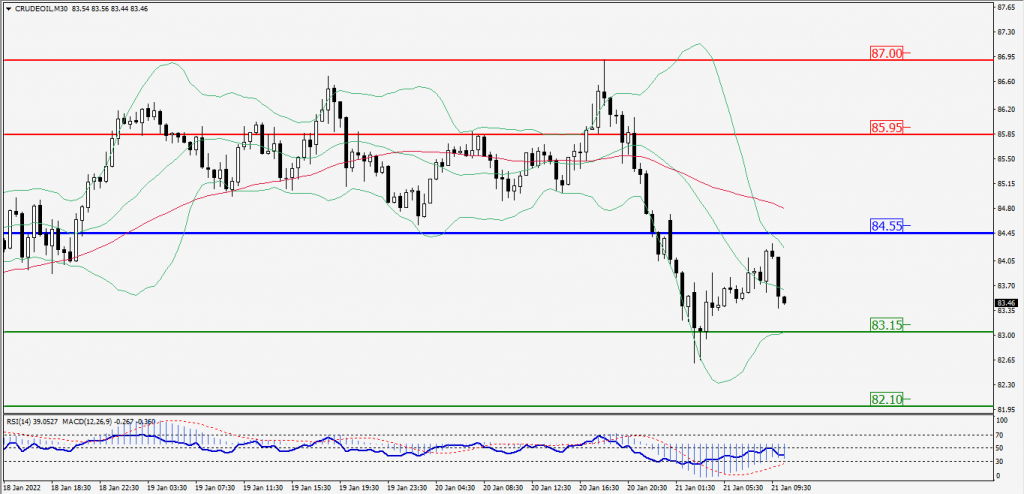
Green Lines Indicate Resistance Levels – Red Lines Indicates Support Levels
Light Blue is a Pivot Point – Black represents the price when the report was produced
XAU/USD Intraday: Major Trend on the Upside
Our pivot point is 1832.90
Preferable Price Action: Further Upside to 1846.10 and 1855.00.
Alternative Price Action: If the price gives a Downside breakout of a pivot, then the price extends to 1819.70 and 1810.80.
Comment: MACD is a Negative territory.
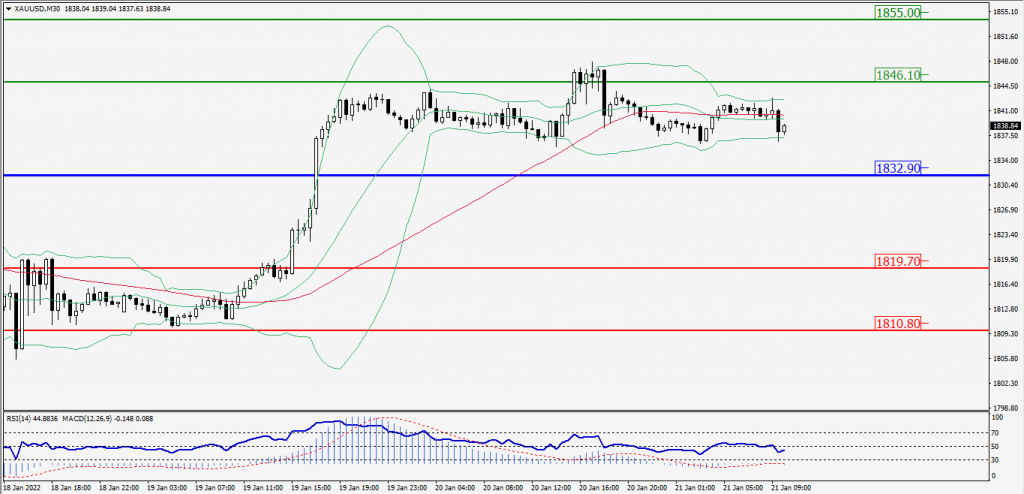
Green Lines Indicate Resistance Levels – Red Lines Indicates Support Levels
Light Blue is a Pivot Point – Black represents the price when the report was produced
Dow Jones Intraday: Trend on the Downside
Our pivot point is 34,986.00
Preferable Price Action: Take Short positions Below pivot with targets at 34,499.00 & 34,117.00.
Alternative Price Action: Above 34,986.00 looks for further Upside to 35,473.00 & 35,855.00.
Comment: RSI at 50 levels And price is Below 55MA.
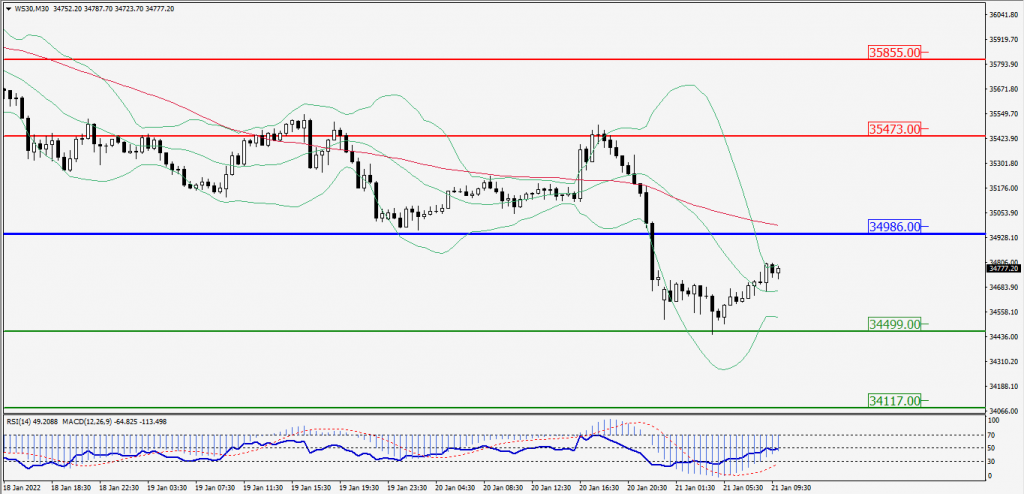
Green Lines Indicate Resistance Levels – Red Lines Indicates Support Levels
Light Blue is a Pivot Point – Black represents the price when the report was produced