Market Wrap: Stocks, Bonds, Commodities
Wall Street’s main indices ended sharply lower on Thursday, with the tech-heavy Nasdaq confirming it was in a correction, after a diverse set of corporate earnings and as investors continued to worry about higher US Treasury yields and the Federal Reserve tightening monetary policy.
The S&P 500 Lost (0.97%) to end at 4,532.76 points, while the Nasdaq Composite loos 166.60 points (1.15%) to 14,340.30. The Dow Jones Industrial fell (0.96%) to 35,028.65.
MSCI’s index of Asia-Pacific stocks outside Japan rose 1.29%, to 801.38 levels. Australian index up 0.14% to 7,342.40. Japanese Nikkei Index gain 1.11% to 27,772.93.
European stocks were negative on Thursday, with the Stoxx Europe 50 Index fell 0.13% to 4,262.55 Germany’s DAX stair down 0.06% to 15,800.41, and France’s CAC fell 0.31% to 7,151.02, and U.K.’s FTSE 100 pulled down 0.08% to 7,583.80.
Benchmark 10-year U.S. Treasury ascend as demand for safe assets gains again, today 10-year bond yields rose to 1.19% to 1.849.
Oil prices hover around 2014 highs, supported by supply concerns.
Spot Brent crude oil loos 0.61% to $87.90 per barrel. US West Texas Intermediate crude up 0.37% to $85.48 a barrel.
The yellow metal gold is Fell 0.15% to 1,840.45 dollars per ounce.
Market Wrap: Forex
The dollar edged lower on Thursday as this week’s rally in U.S. Treasury yields paused, and currencies such as the Canadian and Australian dollars were boosted by high commodity prices and continued optimism about future global economic growth.
Today, the U.S. dollar index measures the greenback against a trade-weighted basket of six major currencies, which is flat 95.490.
The Euro US Dollar (EUR/USD) is a widely traded pair that is gained today. This left the pair trading around $1.13550.
The Japanese yen strengthened against the U.S. dollar on Thursday as the stock pulled up. Today USD/JPY is high to 0.05% at 114.380 level.
Another commodity-related currency mixed against the U.S dollar, AUD/USD gained 0.34% to 0.72350, and NZD/USD fell 0.15% to 0.67760 level.
EUR/USD Intraday: Trend on The Major Upside
Our pivot point is at 1.13450
Preferable Price Action: Take Long positions above pivot level with targets at 1.13720 & 1.13940 in extension.
Alternative Price Action: Below pivot looks for a further Downside to 1.13180 & 1.12960.
Comment: Pair Above 55MA and RSI above 50 levels.
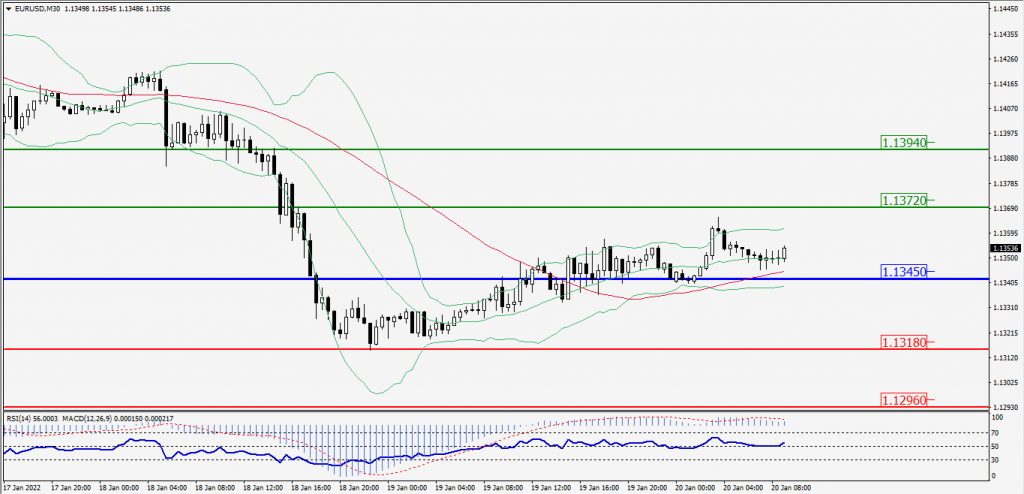
Green Lines Indicate Resistance Levels – Red Lines Indicates Support Levels
Light Blue is a Pivot Point – Black represents the price when the report was produced
GBP/USD Intraday: Major Support at 1.36120
Our pivot point is at 1.36120
Preferable Price Action: Buy positions Above pivot with targets at 1.36540 & 1.36800 in extension.
Alternative Price Action: The price Below pivot would call for further Downside to 1.35700 & 1.35440.
Comment: Pair Above its 20MA & 55MA and RSI above 50 levels.
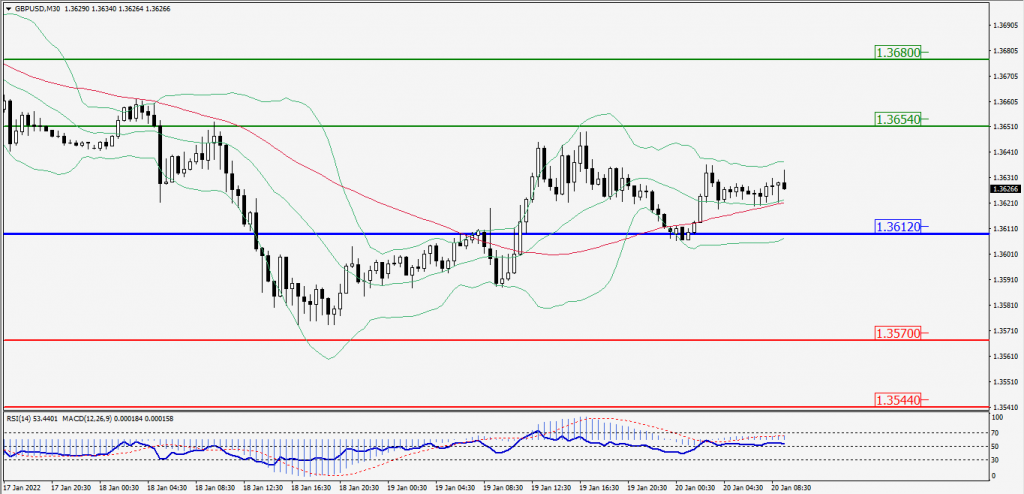
Green Lines Indicate Resistance Levels – Red Lines Indicates Support Levels
Light Blue is a Pivot Point – Black represents the price when the report was produced
USD/JPY Intraday: Trend on The Major Downside
Our pivot point is at 114.590
Preferable Price Action: Sell position Below pivot with the target at 114.170 and 113.850 in extension.
Alternative Price Action: The Upside breakout of the pivot would call for 115.010 and 115.330.
Comment: Pair Above its 55MA & 20MA and MACD in positive territory.
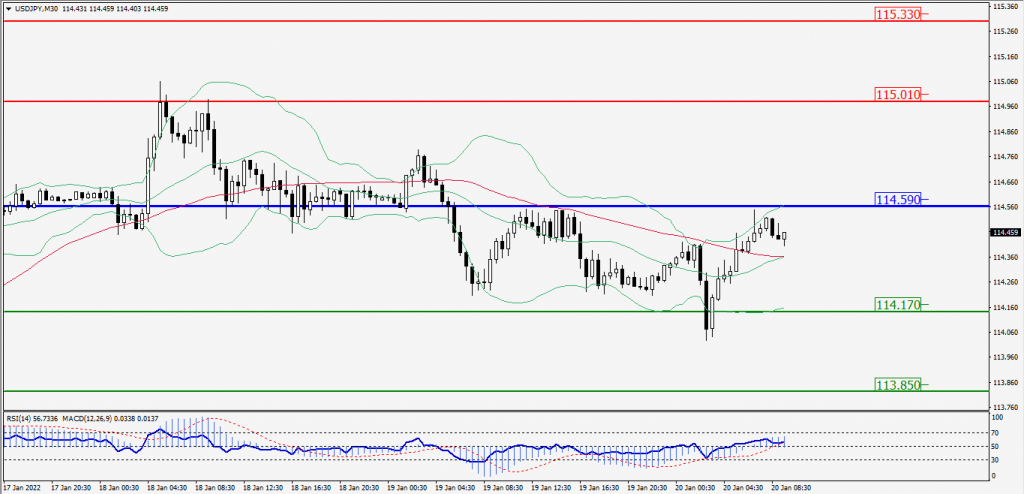
Green Lines Indicate Resistance Levels – Red Lines Indicates Support Levels
Light Blue is a Pivot Point – Black represents the price when the report was produced
AUD/USD Intraday: Trend on the Upside
Our pivot point is at 0.72280
Preferable Price Action: Buy Positions Above pivot with targets at 0.72540 & 0.72770 in extension.
Alternative Price Action: Below pivot looks for a further Downside with 0.72020 & 0.71790 as targets.
Comment: Pair Above its 55MA & 20MA and RSI above 50 levels.
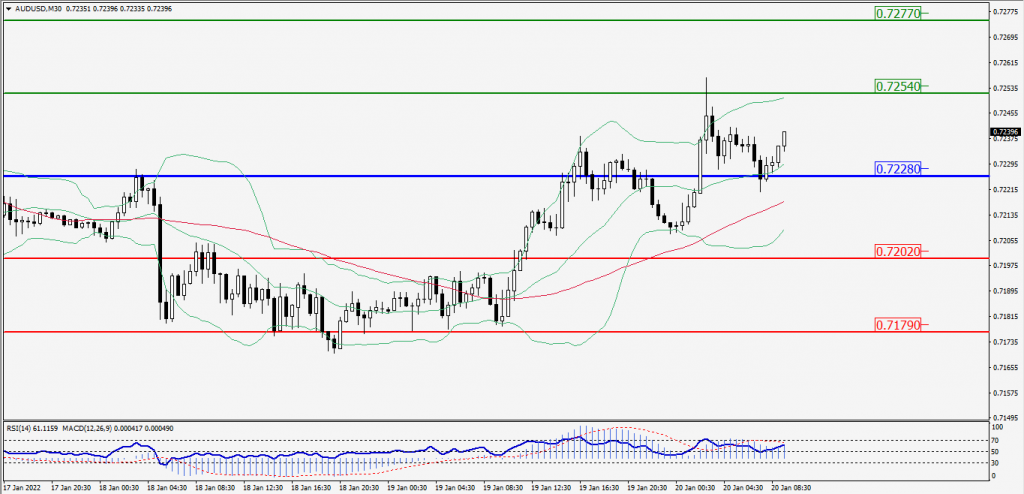
Green Lines Indicate Resistance Levels – Red Lines Indicates Support Levels
Light Blue is a Pivot Point – Black represents the price when the report was produced
CRUDEOIL Intraday: Major Resistance at 85.80
Our pivot point is at 85.80
Preferable Price Action: Below pivots Sell Oil with 84.65 & 83.70 as targets.
Alternative Price Action: Buy crude Above pivot with targets at 86.95 and 87.90 in extension.
Comment: Price Below 55MA and MACD is in the negative territory.
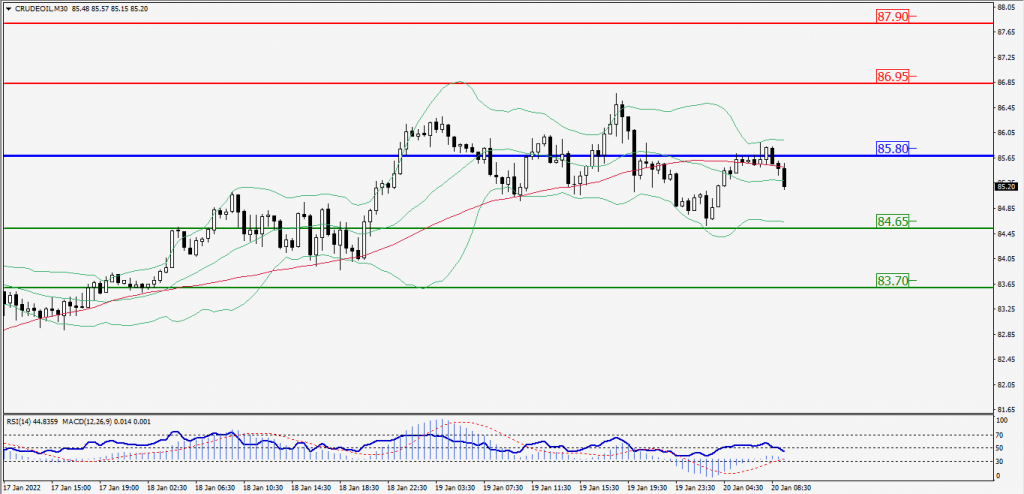
Green Lines Indicate Resistance Levels – Red Lines Indicates Support Levels
Light Blue is a Pivot Point – Black represents the price when the report was produced
XAU/USD Intraday: Major Trend on the Upside
Our pivot point is 1836.70
Preferable Price Action: Further Upside to 1846.30 and 1854.20.
Alternative Price Action: If the price gives a Downside breakout of a pivot, then the price extends to 1828.80 and 1820.90.
Comment: MACD is a Positive territory and the price is above 55MA.
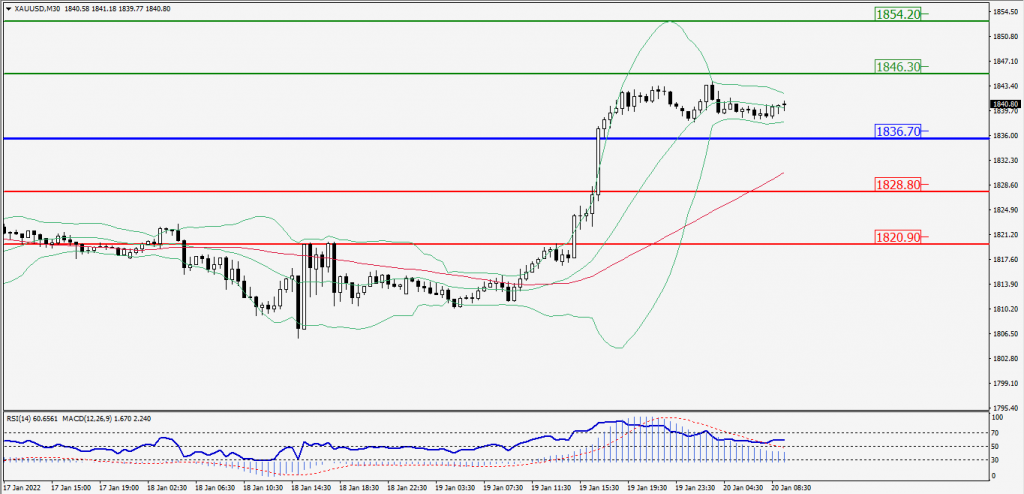
Green Lines Indicate Resistance Levels – Red Lines Indicates Support Levels
Light Blue is a Pivot Point – Black represents the price when the report was produced
Dow Jones Intraday: Trend on the Downside
Our pivot point is 35,319.00
Preferable Price Action: Take Short positions Below pivot with targets at 34,997.00 & 34,729.00.
Alternative Price Action: Above 35,319.00 looks for further Upside to 35,641.00 & 35,909.00.
Comment: RSI below 50 levels And price is Below 55MA.
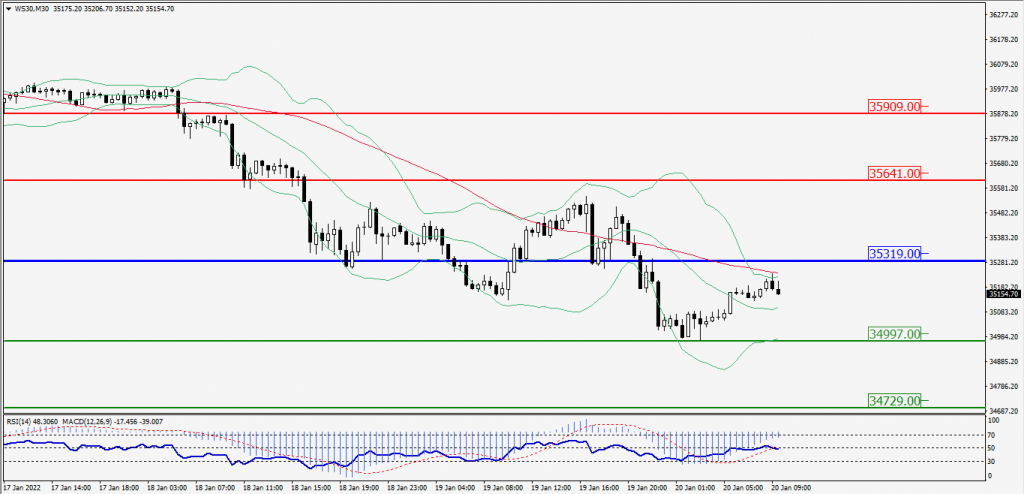
Green Lines Indicate Resistance Levels – Red Lines Indicates Support Levels
Light Blue is a Pivot Point – Black represents the price when the report was produced