Market Wrap: Stocks, Bonds, Commodities
European stock markets are expected to open in a mixed fashion Friday with an economic data deluge set to offer more clues about the extent of the regional slowdown.
The Dow Jones Industrial Average fell 110.39 points to 33,786.62, the S&P 500 lose 0.60% to 4,129.79 and the Nasdaq Composite subtract 97.67 points to 12,059.56.
MSCI’s index of Asia-Pacific stocks outside Japan is decline 1.07% to 633.07 levels. The Australian index was lower by 0.43% to 7,330.40. Japanese Nikkei Index decline 0.33% today.
European stocks were negative on Friday, with the Stoxx Europe 50 Index fell 0.34% to 4,368.95, Germany’s DAX decline 0.46% to 15,727.25, and France’s CAC drop 0.16% to 7,526.67, and U.K.’s FTSE 100 subtract 0.13% to 7,892.70.
Benchmark 10-year U.S. Treasury fell as demand for safe assets ascend again, today 10-year bond yields are positive 0.21% to 3.5370.
Oil prices slid by about $2 a barrel to their lowest level since late March on Thursday, dragged lower by fears a possible recession could dent fuel demand and after a rise in US gasoline inventories.
Spot Brent crude oil drop 0.51% to $80.69 per barrel. US West Texas Intermediate crude is down 0.56% to $76.94 a barrel.
The yellow metal gold is decline 1.18% to 1,995.35 dollars per ounce.
Market Wrap: Forex
The U.S. dollar edged higher in the early European session Friday, and looks set to post its first weekly gain in more than a month on growing expectations that the Federal Reserve will tighten monetary policy further next month.
Today, the U.S. dollar index measures the Greenback against a trade-weighted basket of six major currencies, which surge 0.17% to 101.730.
The Euro US Dollar (EUR/USD) is a widely traded pair that is down 0.16% today. This left the pair trading around $1.09490.
The Japanese yen was negative against the U.S. dollar on Friday. Today USD/JPY is slipped 0.15% to the 134.030 level.
Another commodity-related currency negative against the U.S dollar, AUD/USD fell 0.88% to 0.66820, and NZD/USD slipped 0.64% to 0.61300 level.
EUR/USD Intraday: Trend on the downside
Our pivot point is at 1.09530
Preferable Price Action: Take sell positions below pivot level with targets at 1.09330 & 1.09210 in extension.
Alternative Price Action: Above pivot looks for a further upside to 1.09680 & 1.09790.
Comment: RSI is below 50 levels and Pairs below its 20MA & 55MA.
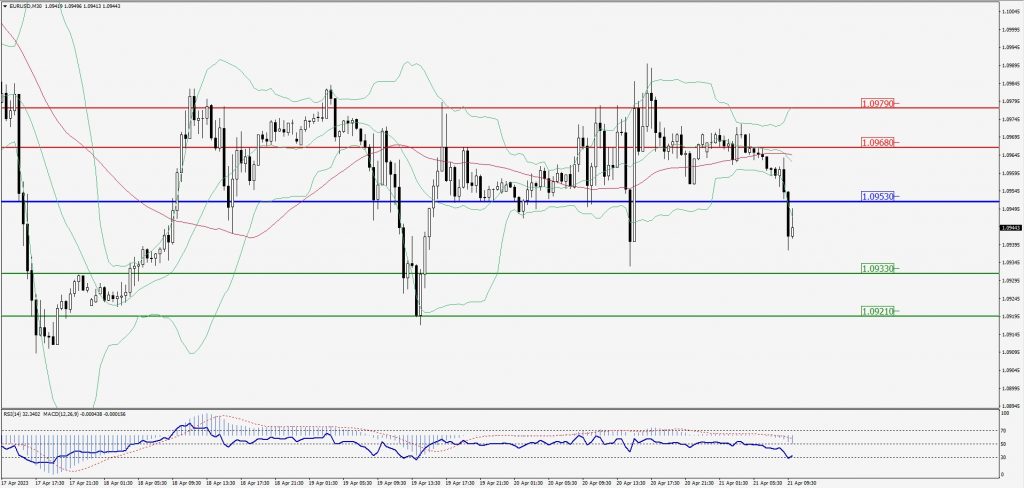
Green Lines Indicate Resistance Levels – Red Lines Indicate Support Levels
Light Blue is a Pivot Point – Black represents the price when the report was produced
GBP/USD Intraday: Major trend on the downside
Our pivot point is at 1.24150
Preferable Price Action: Sell positions below pivot with targets at 1.23870 & 1.23700 in extension.
Alternative Price Action: The price above pivot would call for further upside to 1.24380 & 1.24550.
Comment: RSI is above 50 levels and Pairs above its 20MA & 55MA.
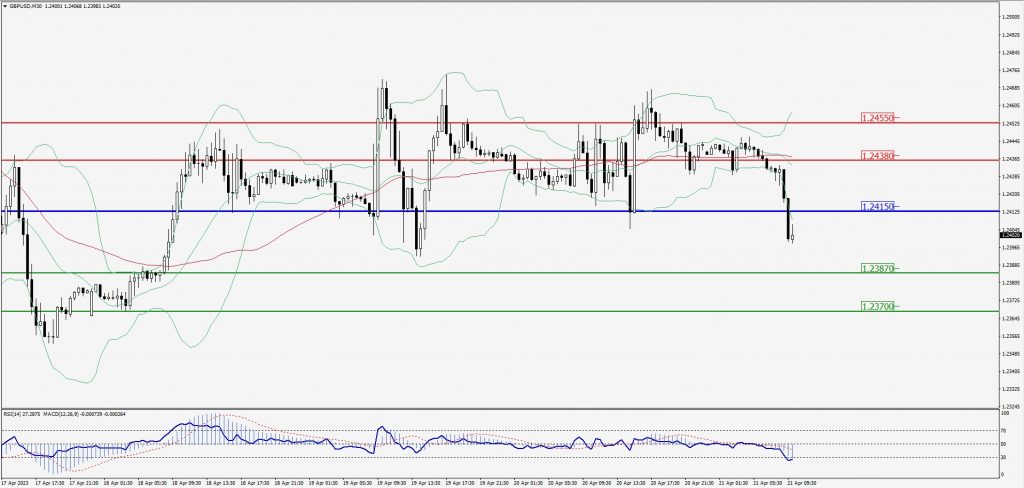
Green Lines Indicate Resistance Levels – Red Lines Indicate Support Levels
Light Blue is a Pivot Point – Black represents the price when the report was produced
USD/JPY Intraday: Trend on the downside
Our pivot point is at 134.070
Preferable Price Action: Sell position below pivot with the target at 133.750 and 133.550 in extension.
Alternative Price Action: The upside breakout of the pivot would call for 134.350 and 134.540.
Comment: MACD is below 50 level and Pairs below its 20MA & 55MA.
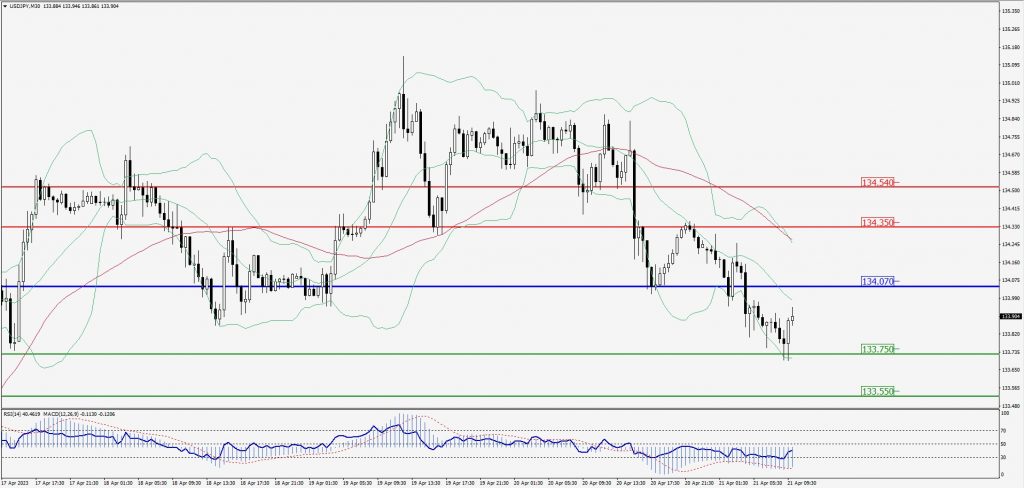
Green Lines Indicate Resistance Levels – Red Lines Indicate Support Levels
Light Blue is a Pivot Point – Black represents the price when the report was produced
AUD/USD Intraday: Trend on downside
Our pivot point is at 0.67030
Preferable Price Action: Sell positions below pivot with targets at 0.66830 & 0.66710 in extension.
Alternative Price Action: Above pivot looks for a further upside with 0.67200 & 0.67330 as targets.
Comment: RSI is below 50 levels and Pairs below its 20MA & 55MA.
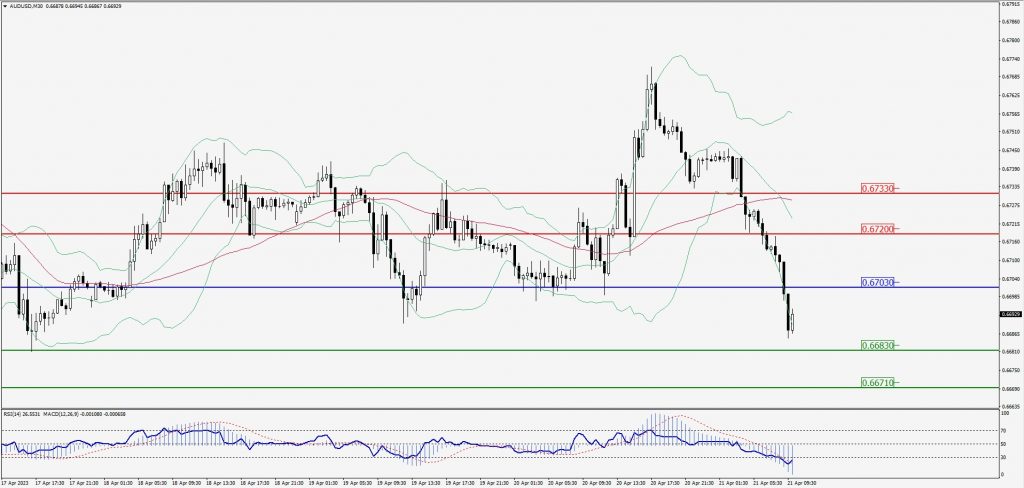
Green Lines Indicate Resistance Levels – Red Lines Indicate Support Levels
Light Blue is a Pivot Point – Black represents the price when the report was produced
CRUDEOIL Intraday: Resistance level at 77.34
Our pivot point is at 77.34
Preferable Price Action: Below pivot sell oil with 76.07 & 75.17 as targets.
Alternative Price Action: Buy crude above pivot with targets at 78.70 and 79.74 in extension.
Comment: MACD is negative territory and Pairs below its 20MA & 55MA.
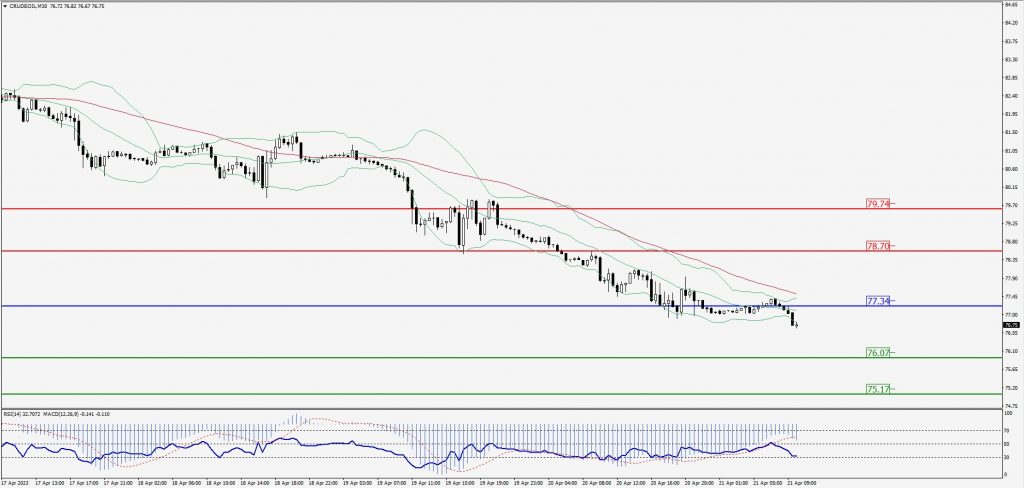
Green Lines Indicate Resistance Levels – Red Lines Indicate Support Levels
Light Blue is a Pivot Point – Black represents the price when the report was produced
XAU/USD Intraday: Trend on the downside
Our pivot point is 1988.90
Preferable Price Action: Further downside to 1979.80 and 1973.90
Alternative Price Action: If the price gives an upside breakout of a pivot, then the price extends to 1997.20 and 2003.30.
Comment: MACD is below 50 level and Pairs below its 20MA & 55MA.
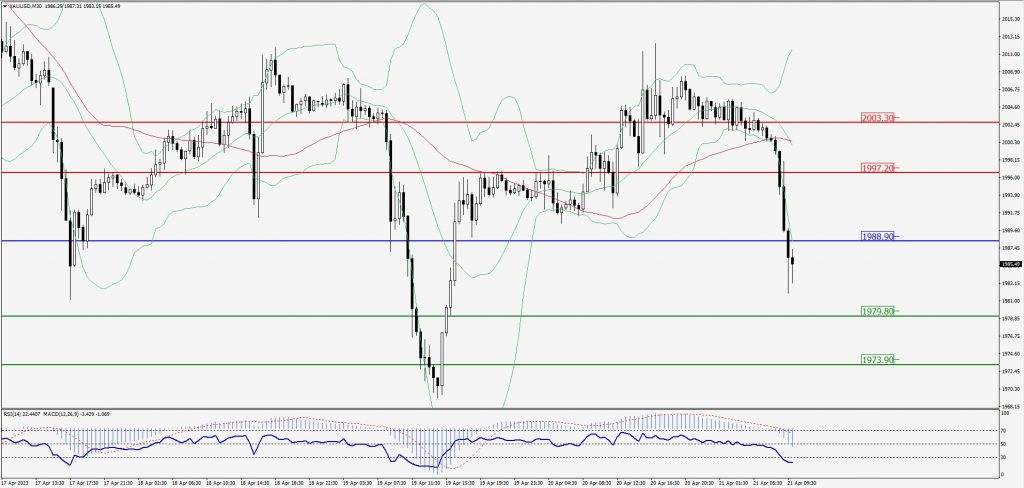
Green Lines Indicate Resistance Levels – Red Lines Indicate Support Levels
Light Blue is a Pivot Point – Black represents the price when the report was produced
Dow Jones Intraday: Resistance level at 33,772.00
Our pivot point is 33,772.00
Preferable Price Action: Take sell positions below the pivot with targets at 33,673.00 & 33,611.00.
Alternative Price Action: Above 33,772.00 looks for further upside to 33,855.00 & 33,929.00.
Comment: RSI is below 50 levels and Pairs below its 20MA & 55MA.
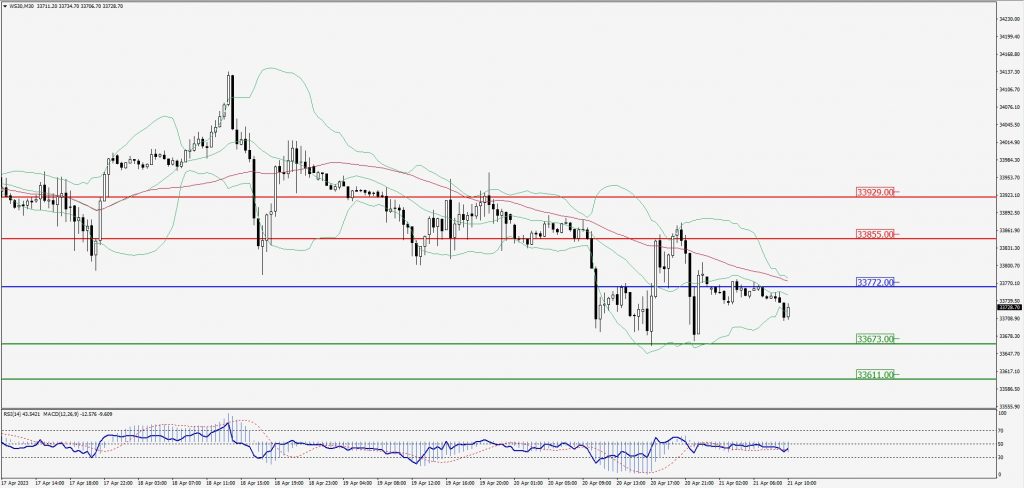
Green Lines Indicate Resistance Levels – Red Lines Indicate Support Levels
Light Blue is a Pivot Point – Black represents the price when the report was produced