Market Wrap: Stocks, Bonds, Commodities
Australia stocks were lower after the close on Monday, as losses in the Metals & Mining, Materials and Resources sectors led shares lower.
The Dow Jones Industrial Average rose 22.34 points to 33,808.96, the S&P 500 gain 0.09% to 4,133.52 and the Nasdaq Composite add 12.90 points to 12,072.46.
MSCI’s index of Asia-Pacific stocks outside Japan is decline 0.38% to 631.26 levels. The Australian index was lower by 0.11% to 7,322.00. Japanese Nikkei Index advance 0.10% today.
European stocks were negative on Monday, with the Stoxx Europe 50 Index fell 0.16% to 4,401.35, Germany’s DAX decline 0.03% to 15,875.95, and France’s CAC drop 0.16% to 7,564.64, and U.K.’s FTSE 100 subtract 0.08% to 7,907.72.
Benchmark 10-year U.S. Treasury fell as demand for safe assets ascend again, today 10-year bond yields are negative 0.91% to 3.5390.
Oil prices edged higher on Friday on strong economic data in the euro zone and Britain, but futures were on track for a weekly loss as interest rate uncertainty weighed.
Spot Brent crude oil drop 0.33% to $81.18 per barrel. US West Texas Intermediate crude is down 0.23% to $77.67 a barrel.
The yellow metal gold is advance 0.33% to 1,997.10 dollars per ounce.
Market Wrap: Forex
The U.S. dollar edged higher in early European trade Monday, but was on track for a second straight monthly loss ahead of the release of more economic data which is likely to shed more light on the future path of interest rates.
Today, the U.S. dollar index measures the Greenback against a trade-weighted basket of six major currencies, which slipped 0.29% to 101.250.
The Euro US Dollar (EUR/USD) is a widely traded pair that is up 0.30% today. This left the pair trading around $1.10200.
The Japanese yen was negative against the U.S. dollar on Monday. Today USD/JPY is surged 0.14% to the 134.340 level.
Another commodity-related currency positive against the U.S dollar, AUD/USD rose 0.04% to 0.66930, and NZD/USD surged 0.34% to 0.61530 level.
EUR/USD Intraday: Trend on the upside
Our pivot point is at 1.09890
Preferable Price Action: Take buy positions above pivot level with targets at 1.10070 & 1.10200 in extension.
Alternative Price Action: Below pivot looks for a further downside to 1.09730 & 1.09620.
Comment: RSI is above 50 levels and Pairs above its 20MA & 55MA.
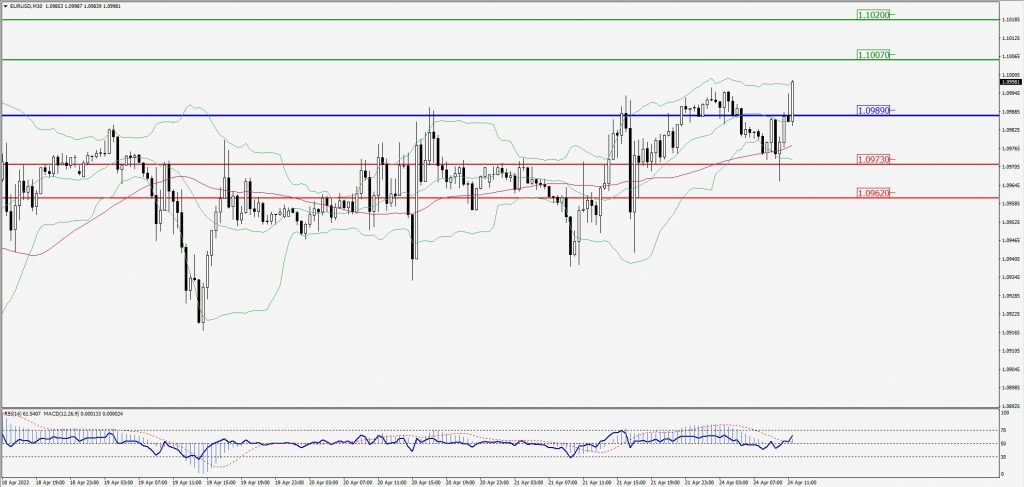
Green Lines Indicate Resistance Levels – Red Lines Indicate Support Levels
Light Blue is a Pivot Point – Black represents the price when the report was produced
GBP/USD Intraday: Trend on the upside
Our pivot point is at 1.24410
Preferable Price Action: Buy positions above pivot with targets at 1.24590 & 1.24720 in extension.
Alternative Price Action: The price below pivot would call for further downside to 1.24250 & 1.24140.
Comment: RSI is above 50 levels and Pairs above its 20MA & 55MA.
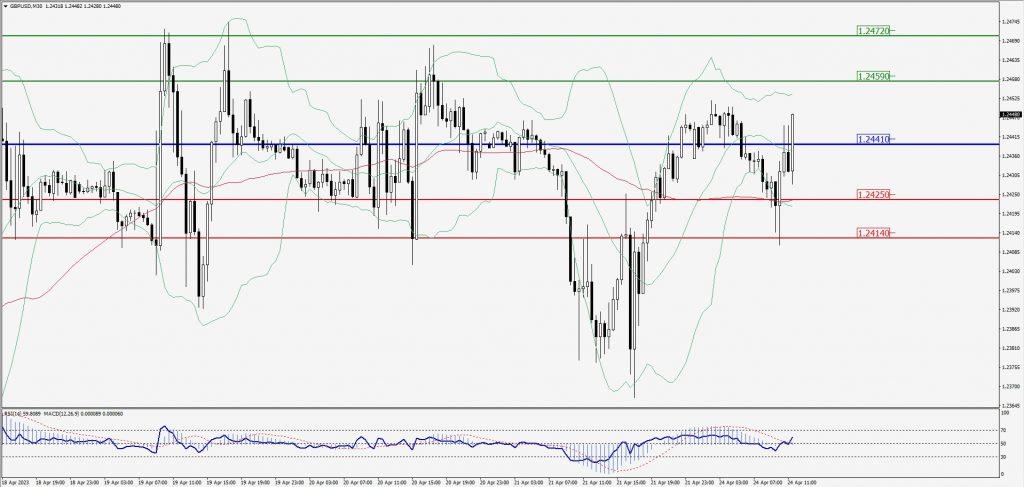
Green Lines Indicate Resistance Levels – Red Lines Indicate Support Levels
Light Blue is a Pivot Point – Black represents the price when the report was produced
USD/JPY Intraday: Support level at 134.260
Our pivot point is at 134.260
Preferable Price Action: Buy position above pivot with the target at 134.510 and 134.670 in extension.
Alternative Price Action: The downside breakout of the pivot would call for 134.070 and 133.910.
Comment: MACD is above 50 level and Pairs above its 20MA & 55MA.
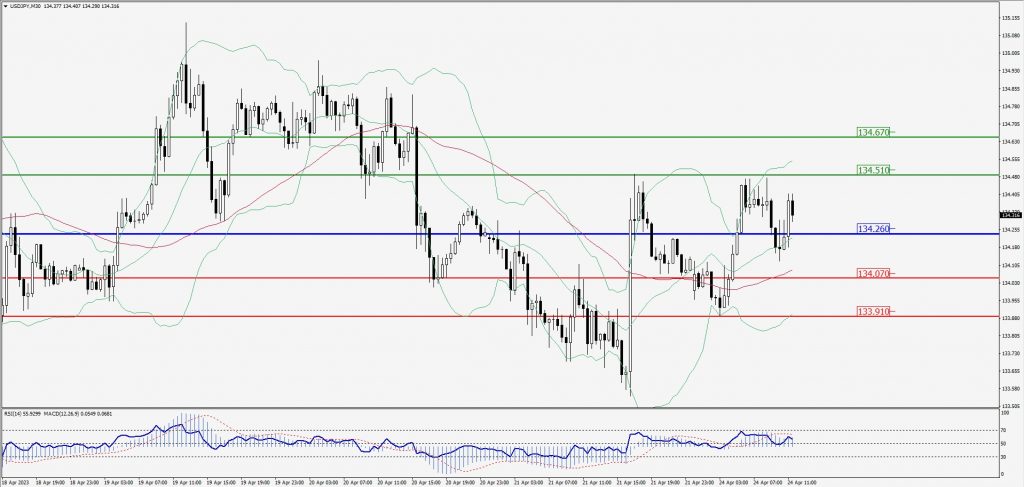
Green Lines Indicate Resistance Levels – Red Lines Indicate Support Levels
Light Blue is a Pivot Point – Black represents the price when the report was produced
AUD/USD Intraday: In a consolidation zone
Our pivot point is at 0.66820
Preferable Price Action: Buy positions above pivot with targets at 0.66990 & 0.67120 in extension.
Alternative Price Action: Below pivot looks for a further downside with 0.66640 & 0.66510 as targets.
Comment: RSI is at 50 levels and Pairs above 20MA.
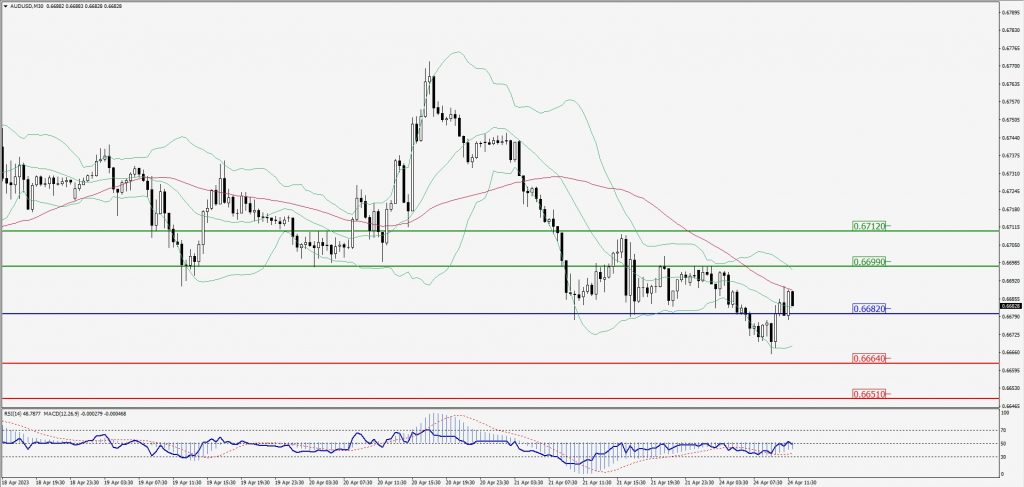
Green Lines Indicate Resistance Levels – Red Lines Indicate Support Levels
Light Blue is a Pivot Point – Black represents the price when the report was produced
CRUDEOIL Intraday: Major trend on the upside
Our pivot point is at 77.35
Preferable Price Action: Above pivot buy oil with 78.56 & 79.38 as targets.
Alternative Price Action: Sell crude below pivot with targets at 76.34 and 75.70 in extension.
Comment: MACD is positive territory and Pairs above its 20MA & 55MA.
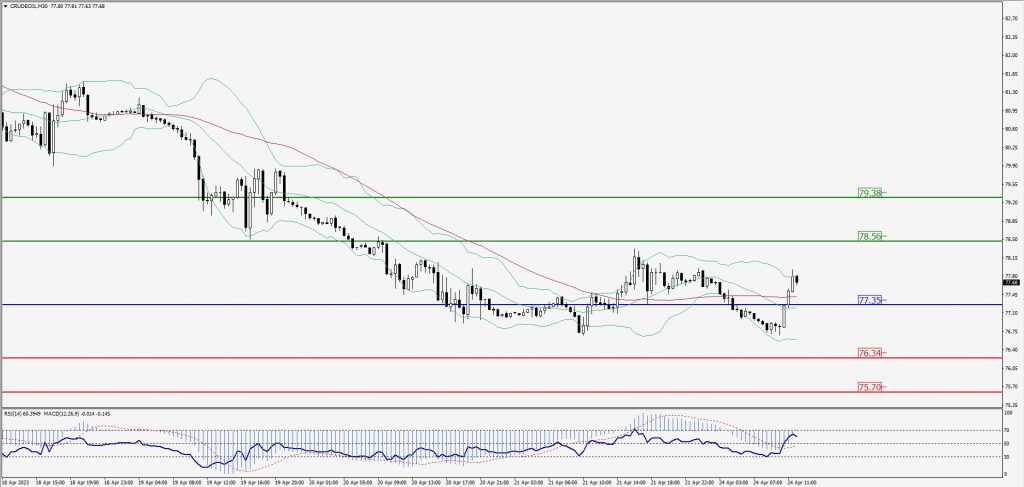
Green Lines Indicate Resistance Levels – Red Lines Indicate Support Levels
Light Blue is a Pivot Point – Black represents the price when the report was produced
XAU/USD Intraday: Trend on the upside
Our pivot point is 1981.70
Preferable Price Action: Further upside to 1989.00 and 1993.70
Alternative Price Action: If the price gives a downside breakout of a pivot, then the price extends to 1975.50 and 1970.60.
Comment: MACD is above 50 level and Pairs above 20MA.
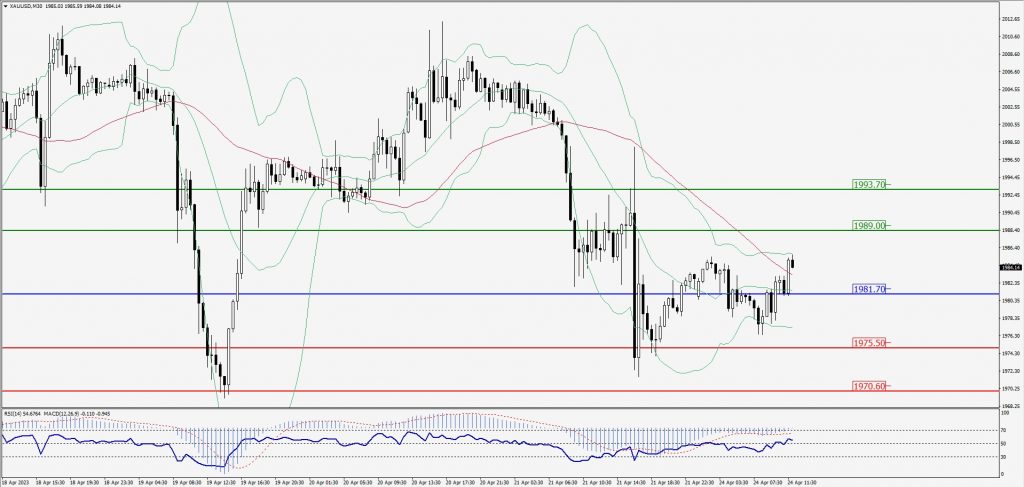
Green Lines Indicate Resistance Levels – Red Lines Indicate Support Levels
Light Blue is a Pivot Point – Black represents the price when the report was produced
Dow Jones Intraday: Trend on the downside
Our pivot point is 33,762.00
Preferable Price Action: Take sell positions below the pivot with targets at 33,656.00 & 33,595.00.
Alternative Price Action: Above 33,762.00 looks for further upside to 33,851.00 & 33,925.00.
Comment: RSI is below 50 levels and Pairs below 55MA.
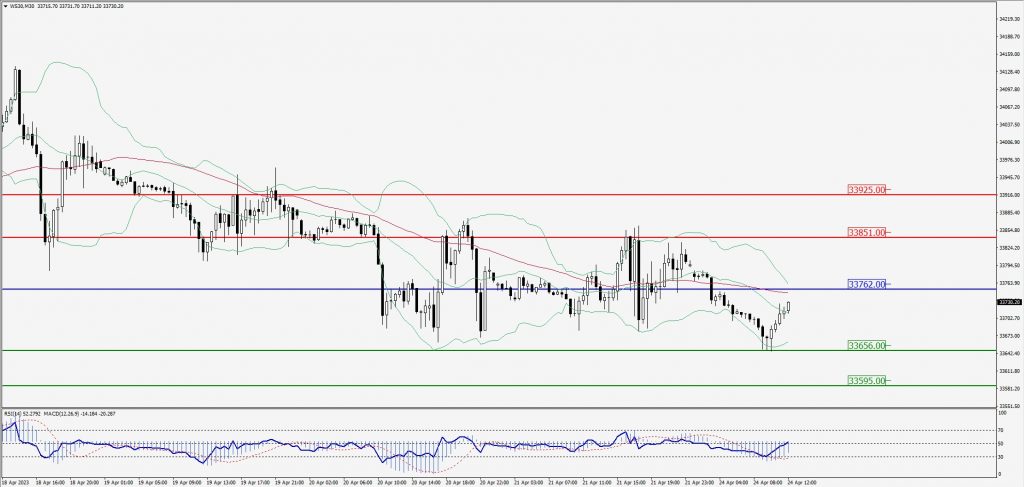
Green Lines Indicate Resistance Levels – Red Lines Indicate Support Levels
Light Blue is a Pivot Point – Black represents the price when the report was produced