Market Wrap: Stocks, Bonds, Commodities
The dollar slipped against the euro on Wednesday, as the common currency recovered from the more than one-month lows hit last week amid political turmoil in Europe.
The Dow Jones Industrial Average rose 56.76 points to 38,834.86, the S&P 500 gain 0.25% to 5,487.03 and the Nasdaq Composite ascend 3.41 points to 17,860.43.
MSCI’s index of Asia-Pacific stocks outside Japan is above 1.48% to 705.97 levels. The Australian index was lower by 0.11% to 7,769.70. Japanese Nikkei Index increase 0.28% today.
European stocks were negative on Wednesday, with the Stoxx Europe 50 Index decrease 0.17% to 4,907.35, Germany’s DAX descend 0.09% to 18,107.15, and France’s CAC lower 0.27% to 7,608.35 and U.K.’s FTSE 100 loss 0.23% to 8,172.28.
Benchmark 10-year U.S. Treasury rose as demand for safe assets slipped again, today 10-year bond yields increase 0.04% to 4.2190.
Oil rose slightly in early trade on Wednesday as concern over escalating conflict in Europe and the Middle East offset demand worries following an unexpected build in U.S. crude inventories.
Spot Brent crude oil down 0.18% to $85.18 per barrel. US West Texas Intermediate crude is down 0.18% to $80.57 a barrel.
The yellow metal gold is decrease 0.05% to 2,345.70 dollars per ounce.
Market Wrap: Forex
The dollar recovered some ground on Wednesday after soft U.S. retail sales data reinforced bets of imminent Federal Reserve rate cuts, while sterling dipped ahead of a reading on UK inflation due later in the day.
Today, the U.S. dollar index measures the Greenback against a trade-weighted basket of six major currencies, which ascend 0.02% to 104.895.
The Euro US Dollar (EUR/USD) is a widely traded pair that is decrease 0.04% today. This left the pair trading around $1.07340.
The Japanese yen was positive against the U.S. dollar on Wednesday. Today USD/JPY is trades pair that decreases 0.07% to the 157.740 level.
Another commodity-related currency mixed against the U.S dollar, AUD/USD slipped 0.26% to 0.66720 , and NZD/USD descend 0.09% to 0.61390 level.
EUR/USD Intraday: Trend on the downside
Our pivot point is at 1.07460
Preferable Price Action: Take sell positions below pivot level with targets at 1.06940 & 1.06460 in extension.
Alternative Price Action: Buy pivot looks for a further upside to 1.07990 & 1.08460.
Comment: RSI is below 50 levels.
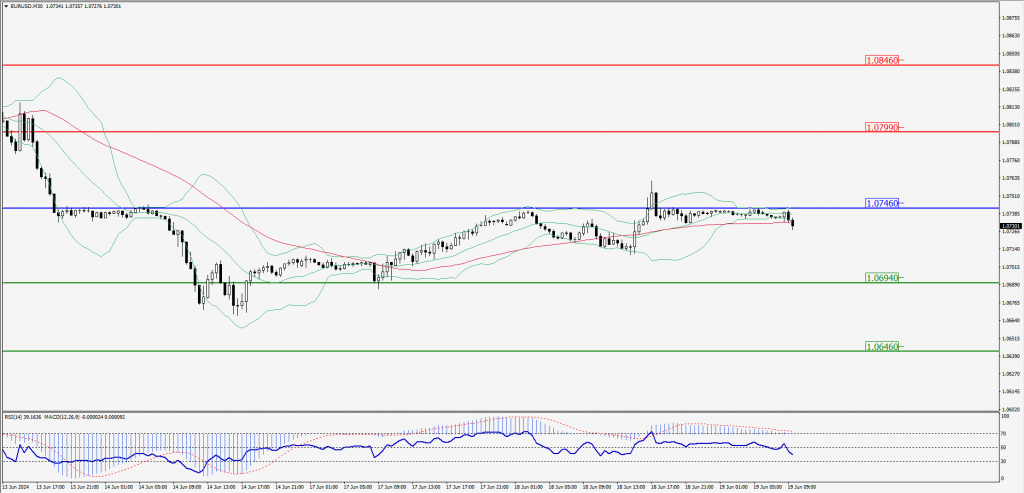
Green Lines Indicate Resistance Levels – Red Lines Indicate Support Levels
Light Blue is a Pivot Point – Black represents the price when the report was produced
GBP/USD Intraday: Trend on the upside
Our pivot point is at 1.27150
Preferable Price Action: Buy positions above pivot with targets at 1.27800 & 1.28370 in extension.
Alternative Price Action: The price below pivot would call for further downside to 1.26480 & 1.25930.
Comment: RSI is above 50 levels and pairs are above its 20MA and 55MA.
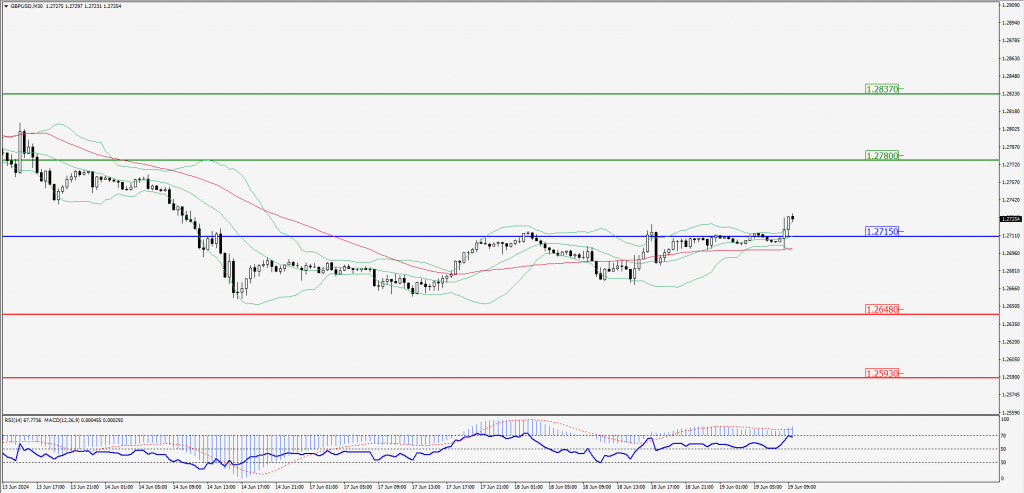
Green Lines Indicate Resistance Levels – Red Lines Indicate Support Levels
Light Blue is a Pivot Point – Black represents the price when the report was produced
USD/JPY Intraday: Trend on the downside
Our pivot point is at 157.940
Preferable Price Action: Sell position below pivot with the target at 157.120 and 156.370 in extension.
Alternative Price Action: The upside breakout of the pivot would call for 158.770 and 159.530.
Comment: MACD is below 50 levels and pairs are below its 20MA and 55MA.
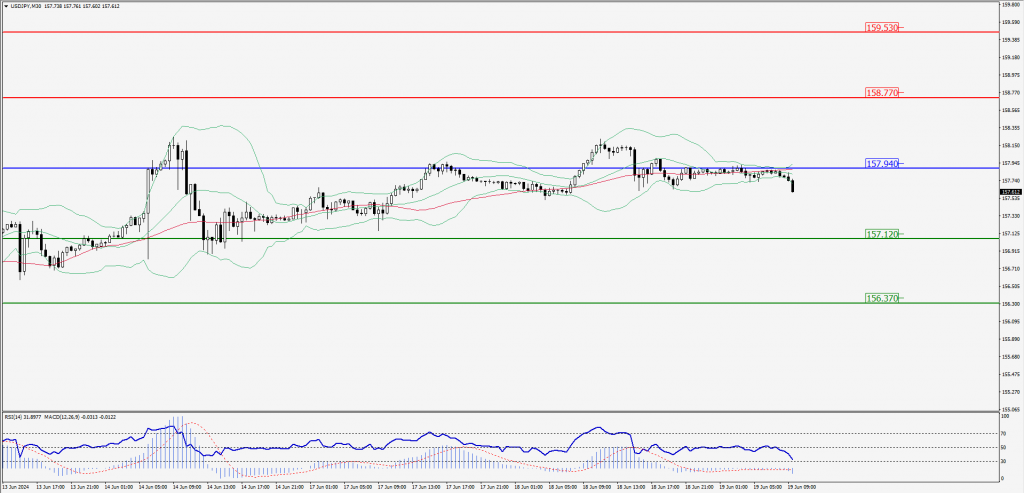
Green Lines Indicate Resistance Levels – Red Lines Indicate Support Levels
Light Blue is a Pivot Point – Black represents the price when the report was produced
AUD/USD Intraday: Trend on the upside
Our pivot point is at 0.66610
Preferable Price Action: Buy positions above pivot with targets at 0.66950 & 0.67260 in extension.
Alternative Price Action: Below pivot a further downside with 0.66270 & 0.65940 as targets.
Comment: RSI is above 50 levels and pairs above its 20MA & 55MA.
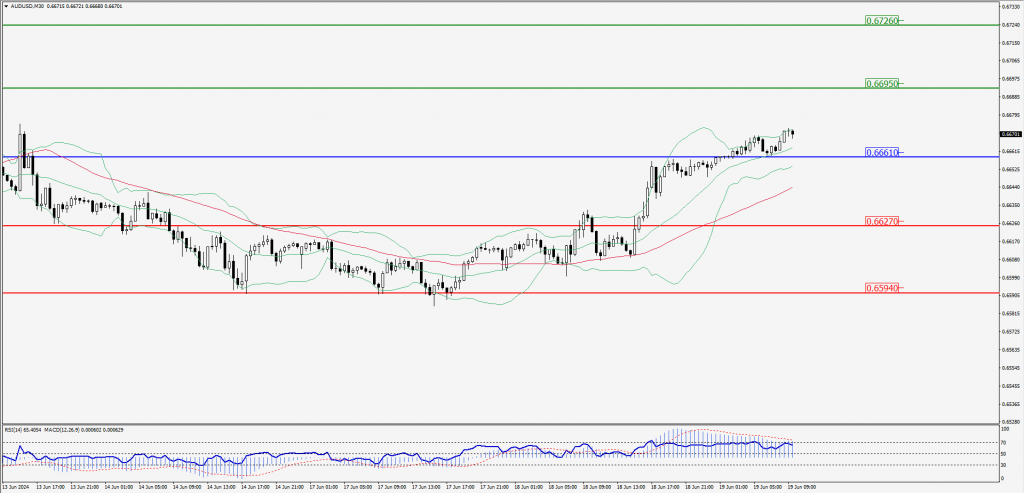
Green Lines Indicate Resistance Levels – Red Lines Indicate Support Levels
Light Blue is a Pivot Point – Black represents the price when the report was produced
CRUDEOIL Intraday: Trend on the downside
Our pivot point is at 80.81
Preferable Price Action: Below pivot sell oil with 79.69 & 78.64 as targets.
Alternative Price Action: Buy crude above pivot with targets at 82.00 and 83.09 in extension.
Comment: RSI is below 50 levels and Pairs below its 20MA.
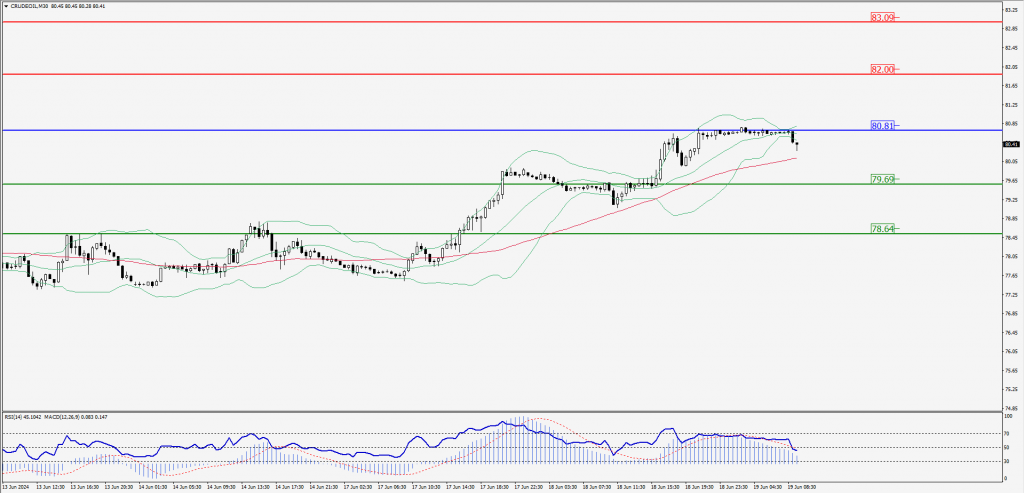
Green Lines Indicate Resistance Levels – Red Lines Indicate Support Levels
Light Blue is a Pivot Point – Black represents the price when the report was produced
XAU/USD Intraday: Trend on the upside
Our pivot point is 2327.90
Preferable Price Action: Further upside to 2343.90 and 2359.30.
Alternative Price Action: If the price gives an downside breakout of a pivot, then the price extends to 2310.90 and 2294.30.
Comment: MACD is above 50 levels and Paris above its 20MA and 55MA.
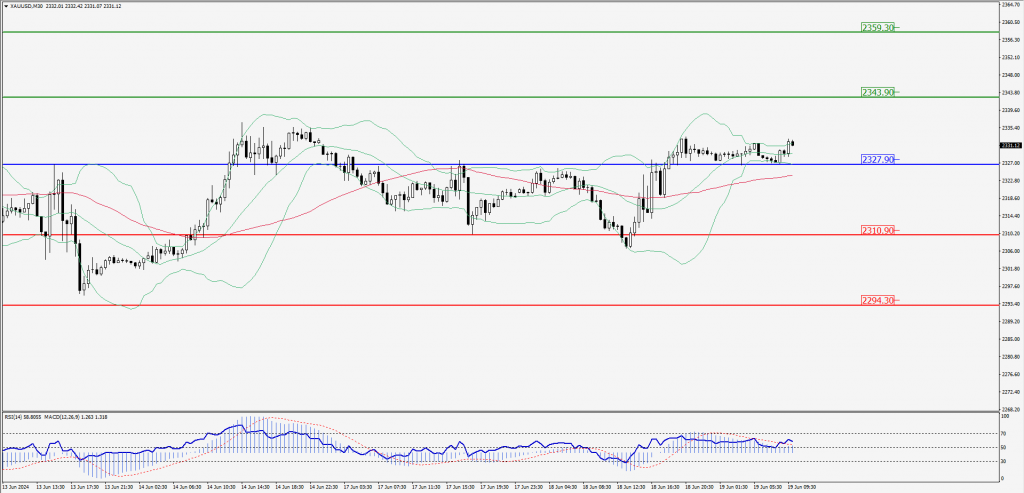
Green Lines Indicate Resistance Levels – Red Lines Indicate Support Levels
Light Blue is a Pivot Point – Black represents the price when the report was produced
Dow Jones Intraday: Trend on the upside
Our pivot point is 38,772.00
Preferable Price Action: Take buy positions above the pivot with targets at 38,935.50 & 39,075.60.
Alternative Price Action: Below 38,772.00 looks for further downside to 38,599.40 & 38,456.70.
Comment: RSI is above 50 levels and pairs above its 55MA.
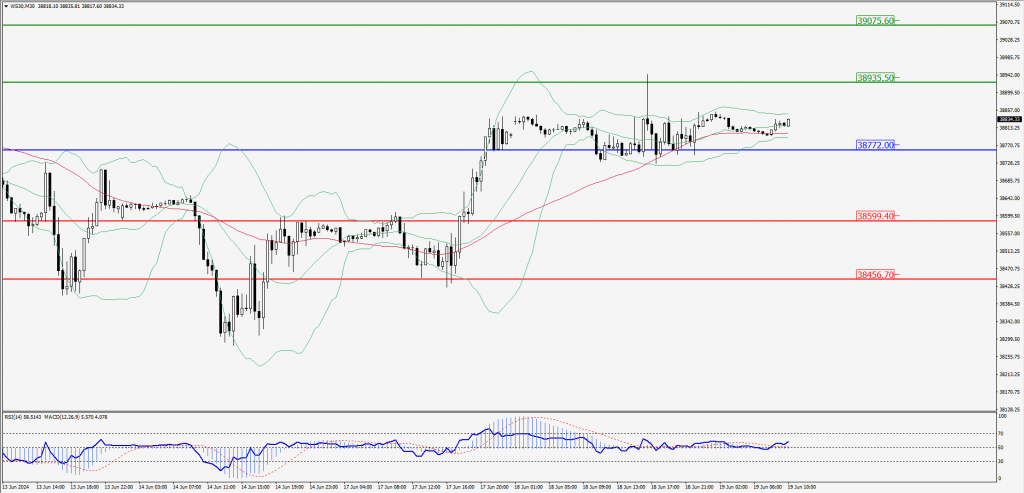
Green Lines Indicate Resistance Levels – Red Lines Indicate Support Levels
Light Blue is a Pivot Point – Black represents the price when the report was produced