Market Wrap: Stocks, Bonds, Commodities
The dollar slipped against the euro on Tuesday, as the common currency recovered from the more than one-month lows hit last week amid political turmoil in Europe.
The Dow Jones Industrial Average rose 188.94 points to 38,778.10, the S&P 500 gain 0.77% to 5,473.23 and the Nasdaq Composite ascend 166.18 points to 17,855.06.
MSCI’s index of Asia-Pacific stocks outside Japan is above 0.55% to 695.93 levels. The Australian index was higher by 1.01% to 7,778.10. Japanese Nikkei Index increase 0.93% today.
European stocks were positive on Tuesday, with the Stoxx Europe 50 Index increase 0.20% to 4,890.15, Germany’s DAX ascend 0.15% to 18,101.45, and France’s CAC higher 0.03% to 7,573.93 and U.K.’s FTSE 100 gain 0.28% to 8,164.76.
Benchmark 10-year U.S. Treasury rose as demand for safe assets slipped again, today 10-year bond yields increase 0.31% to 4.2900.
Asian markets largely gained ground on Tuesday, driven by declining oil prices and expectations that the Federal Reserve will pause interest rate hikes until the end of the year.
Spot Brent crude oil down 0.22% to $84.03 per barrel. US West Texas Intermediate crude is down 0.28% to $79.50 a barrel.
The yellow metal gold is decrease 0.05% to 2,327.90 dollars per ounce.
Market Wrap: Forex
The U.S. dollar edged higher Tuesday ahead of key retail sales data and speeches by Federal Reserve officials, as traders looked for clues to better gauge the timing and pace of interest rate cuts.
Today, the U.S. dollar index measures the Greenback against a trade-weighted basket of six major currencies, which ascend 0.14% to 105.092.
The Euro US Dollar (EUR/USD) is a widely traded pair that is decrease 0.10% today. This left the pair trading around $1.07230.
The Japanese yen was positive against the U.S. dollar on Tuesday. Today USD/JPY is trades pair that increases 0.30% to the 158.190 level.
Another commodity-related currency negative against the U.S dollar, AUD/USD slipped 0.02% to 0.66110 , and NZD/USD descend 0.48% to 0.61000 level.
EUR/USD Intraday: Trend on the upside
Our pivot point is at 1.07200
Preferable Price Action: Take buy positions above pivot level with targets at 1.07670 & 1.08070 in extension.
Alternative Price Action: Sell pivot looks for a further downside to 1.06710 & 1.06300.
Comment: RSI is above 50 levels and pairs are above its 55MA.
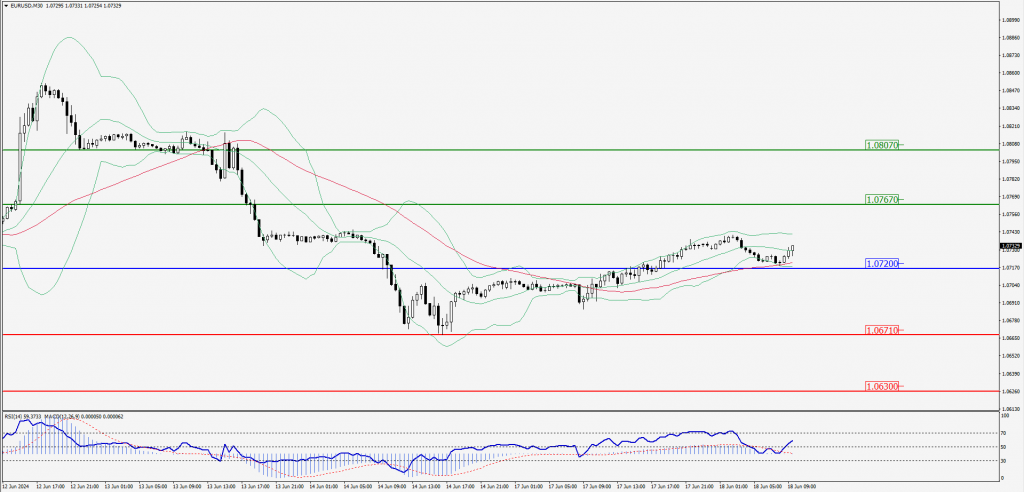
Green Lines Indicate Resistance Levels – Red Lines Indicate Support Levels
Light Blue is a Pivot Point – Black represents the price when the report was produced
GBP/USD Intraday: Trend on the downside
Our pivot point is at 1.27150
Preferable Price Action: Sell positions below pivot with targets at 1.26460 & 1.25870 in extension.
Alternative Price Action: The price above pivot would call for further upside to 1.27830 & 1.28440.
Comment: RSI is below 50 levels and pairs are below its 20MA.
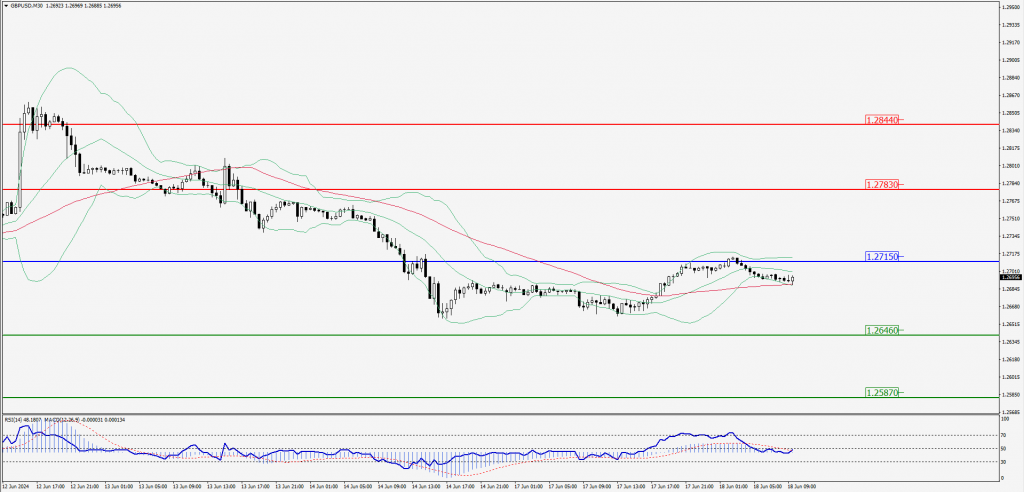
Green Lines Indicate Resistance Levels – Red Lines Indicate Support Levels
Light Blue is a Pivot Point – Black represents the price when the report was produced
USD/JPY Intraday: Major trend on the upside
Our pivot point is at 157.710
Preferable Price Action: Buy position above pivot with the target at 158.500 and 159.200 in extension.
Alternative Price Action: The downside breakout of the pivot would call for 156.910 and 156.190.
Comment: MACD is above 50 levels and pairs are above its 20MA & 55MA.
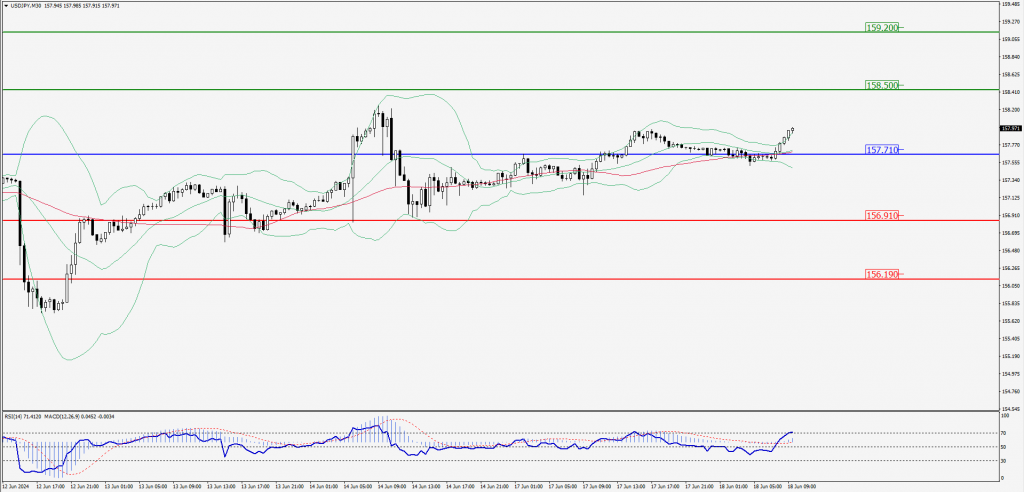
Green Lines Indicate Resistance Levels – Red Lines Indicate Support Levels
Light Blue is a Pivot Point – Black represents the price when the report was produced
AUD/USD Intraday: Major trend on the upside
Our pivot point is at 0.66190
Preferable Price Action: Buy positions above pivot with targets at 0.66610 & 0.67000 in extension.
Alternative Price Action: Below pivot a further downside with 0.65780 & 0.65400 as targets.
Comment: RSI is above 50 levels and pairs above its 55MA & 20MA.
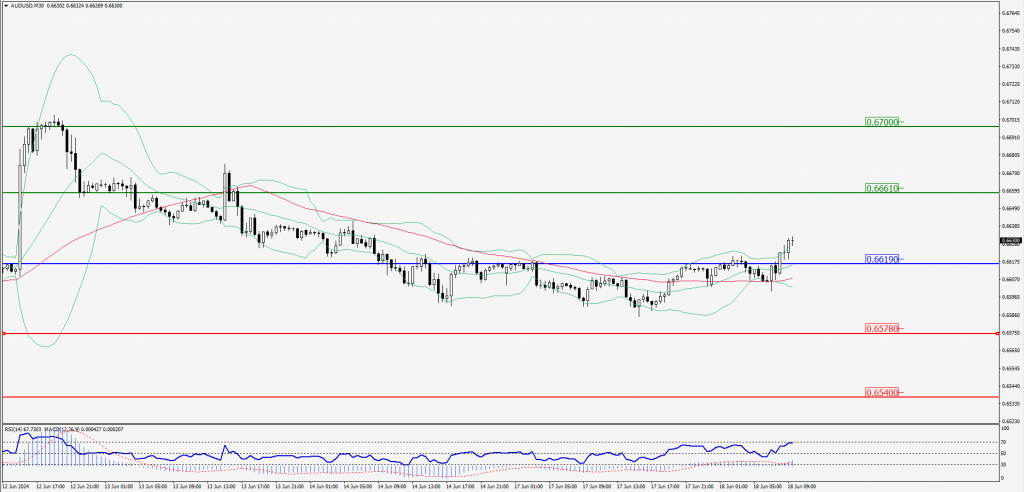
Green Lines Indicate Resistance Levels – Red Lines Indicate Support Levels
Light Blue is a Pivot Point – Black represents the price when the report was produced
CRUDEOIL Intraday: Trend on the upside
Our pivot point is at 79.29
Preferable Price Action: Above pivot buy oil with 80.44 & 81.43 as targets.
Alternative Price Action: Sell crude below pivot with targets at 78.19 and 77.14 in extension.
Comment: RSI is above 50 levels and Pairs above its 55MA.
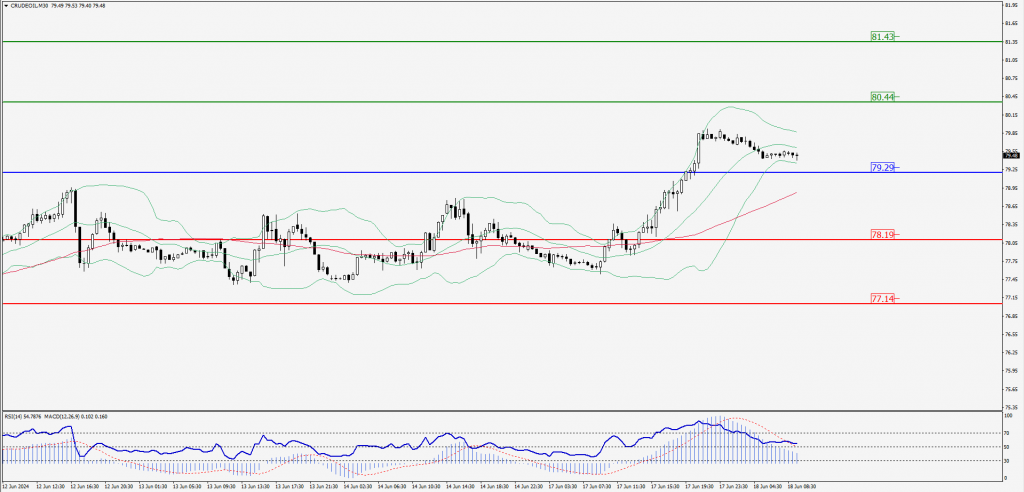
Green Lines Indicate Resistance Levels – Red Lines Indicate Support Levels
Light Blue is a Pivot Point – Black represents the price when the report was produced
XAU/USD Intraday: Resistance level at 2324.60
Our pivot point is 2324.60
Preferable Price Action: Further downside to 2307.80 and 2291.30.
Alternative Price Action: If the price gives an upside breakout of a pivot, then the price extends to 2341.90 and 2358.40.
Comment: MACD is below 50 levels and paris below its 20MA & 55MA.
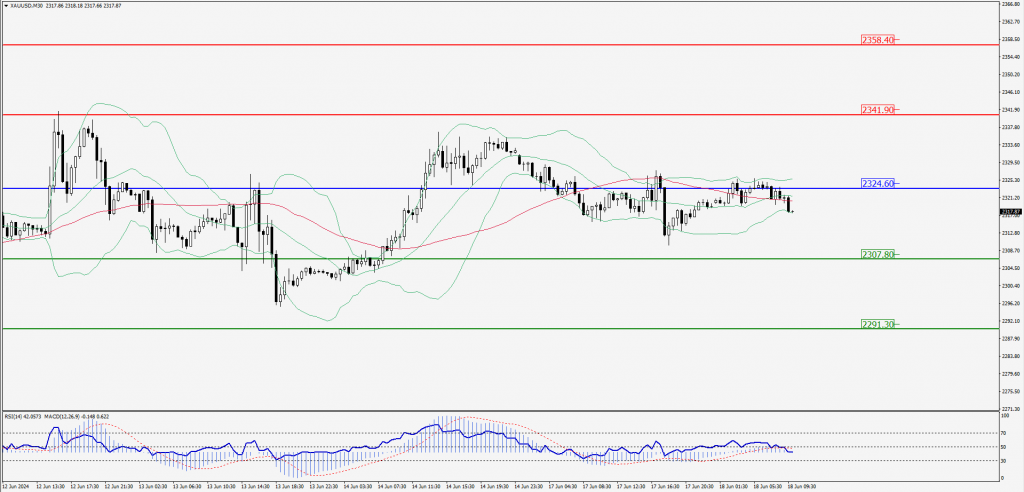
Green Lines Indicate Resistance Levels – Red Lines Indicate Support Levels
Light Blue is a Pivot Point – Black represents the price when the report was produced
Dow Jones Intraday: Trend on the upside
Our pivot point is 38,772.20
Preferable Price Action: Take buy positions above the pivot with targets at 38,936.50 & 39,074.90.
Alternative Price Action: Below 38,772.20 looks for further downside to 38,597.50 & 38,457.90.
Comment: RSI is above 50 levels and pairs above its 55MA.
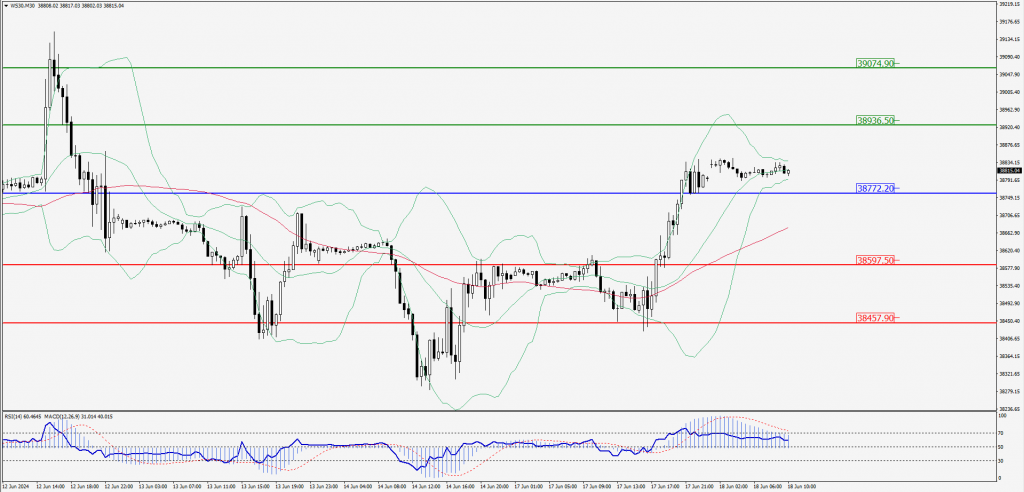
Green Lines Indicate Resistance Levels – Red Lines Indicate Support Levels
Light Blue is a Pivot Point – Black represents the price when the report was produced