Market Wrap: Stocks, Bonds, Commodities
Australia stocks were higher after the close on Friday, as gains in the Energy, IT and Resources sectors led shares higher.
The S&P 500 gain (1.23%) ended at 4,411.67 points, while the Nasdaq Composite accepted 1.33% to 13,614.78. The Dow Jones Industrial was rose 1.23% to 34,480.76.
MSCI’s index of Asia-Pacific stocks outside Japan is losted 0.29% to 715.42 levels. Australian index higher 0.60% to 7,294.40. Japanese Nikkei Index surged 0.65% to 26,827.43.
European stocks were Negative on Friday, with the Stoxx Europe 50 Index down 0.17% to 3,878.55 Germany’s DAX droped 0.29% to 14,346.46, and France’s CAC down 0.29% to 6,593.39, and U.K.’s FTSE 100 droped 0.08% to 7,379.77.
Benchmark 10-year U.S. Treasury fell as demand for safe assets dropped again, today 10-year bond yields a negative 2.182.
Oil prices extended their gains on Friday at the end of a third volatile week of trade after slim progress in peace talks between Russia and Ukraine raised the spectre of tighter sanctions and a prolonged disruption to oil supply.
Spot Brent crude oil gained 1.16% to $107.88 per barrel. US West Texas Intermediate crude up 1.64% to $104.67 a barrel.
The yellow metal gold is descended 0.48% to 1,933.90 dollars per ounce.
Market Wrap: Forex
The dollar was up on Friday morning in Asia but was set for its first down week in six and remained near a one-week low, as the impact of the U.S. Federal Reserve’s latest policy decision continues.
Today, the U.S. dollar index measures the Greenback against a trade-weighted basket of six major currencies, which is rose 0.17% to 98.145.
The Euro US Dollar (EUR/USD) is a widely traded pair that is negative today. This left the pair trading around $1.10750.
The Japanese yen was positive against the U.S. dollar on Friday as the stock up. Today USD/JPY is rose 0.29% to 118.940 level.
Another commodity-related currency positive against the U.S dollar, AUD/USD up 0.19% to 0.73880, and NZD/USD higher 0.15% to 0.68890 level.
EUR/USD Intraday: Support Level at 1.10450
Our pivot point is at 1.10450
Preferable Price Action: Take Long positions above pivot level with targets at 1.11360 & 1.12250 in extension.
Alternative Price Action: Below pivot looks for a further downside to 1.09550 & 1.08660.
Comment: RSI at 50 levels and Pair above 55MA.
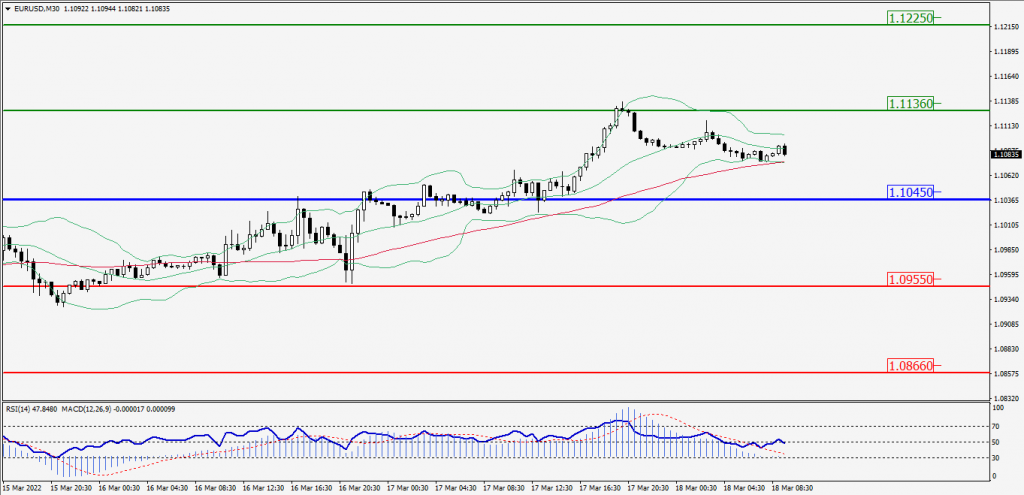
Green Lines Indicate Resistance Levels – Red Lines Indicates Support Levels
Light Blue is a Pivot Point – Black represents the price when the report was produced
GBP/USD Intraday: In a Consolidation Zone
Our pivot point is at 1.31430
Preferable Price Action: Buy positions Above pivot with targets at 1.31870 & 1.32310 in extension.
Alternative Price Action: The price Below pivot would call for further Downside to 1.30980 & 1.30530.
Comment: RSI at 50 levels and Pair above 55MA.
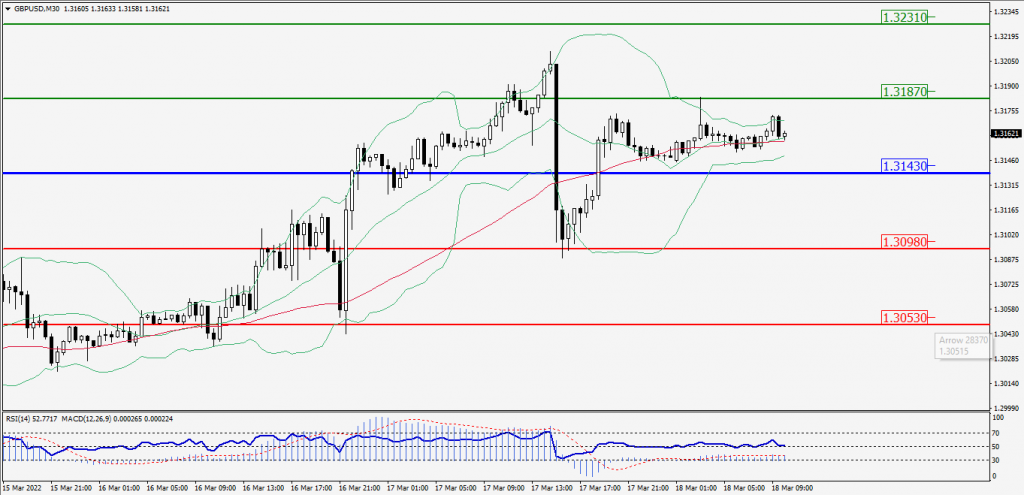
Green Lines Indicate Resistance Levels – Red Lines Indicates Support Levels
Light Blue is a Pivot Point – Black represents the price when the report was produced
USD/JPY Intraday: In a Consolidation Zone
Our pivot point is at 118.640
Preferable Price Action: Buy position Above pivot with the target at 119.160 and 119.690 in extension.
Alternative Price Action: The Downside breakout of the pivot would call for 118.100 and 117.560.
Comment: MACD in Positive territory and Pair Above its 20MA & 55MA.
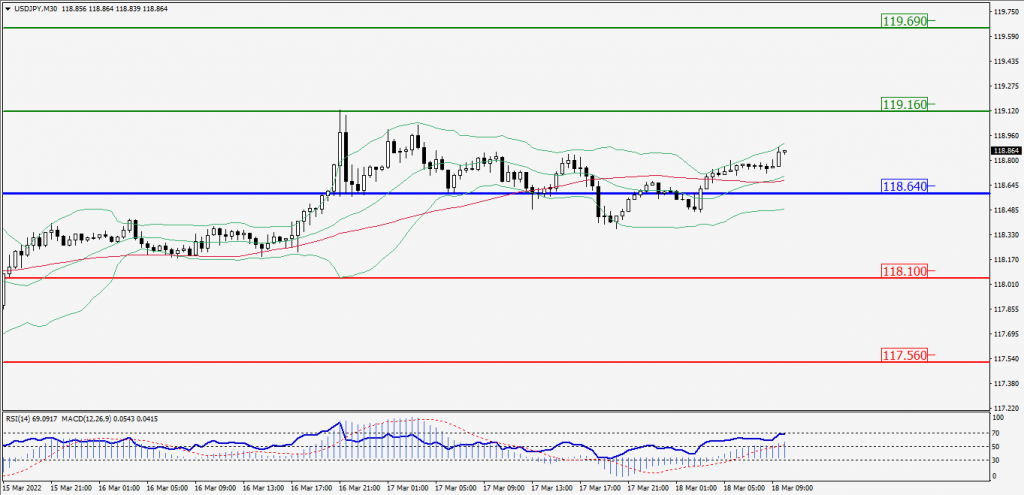
Green Lines Indicate Resistance Levels – Red Lines Indicates Support Levels
Light Blue is a Pivot Point – Black represents the price when the report was produced
AUD/USD Intraday: Trend on the Major Upside
Our pivot point is at 0.73750
Preferable Price Action: Buy Positions Above pivot with targets at 0.74570 & 0.75380 in extension.
Alternative Price Action: Below pivot looks for a further Downside with 0.72910 & 0.72080 as targets.
Comment: RSI above 50 levels and Pair Above its 20MA & 55MA.
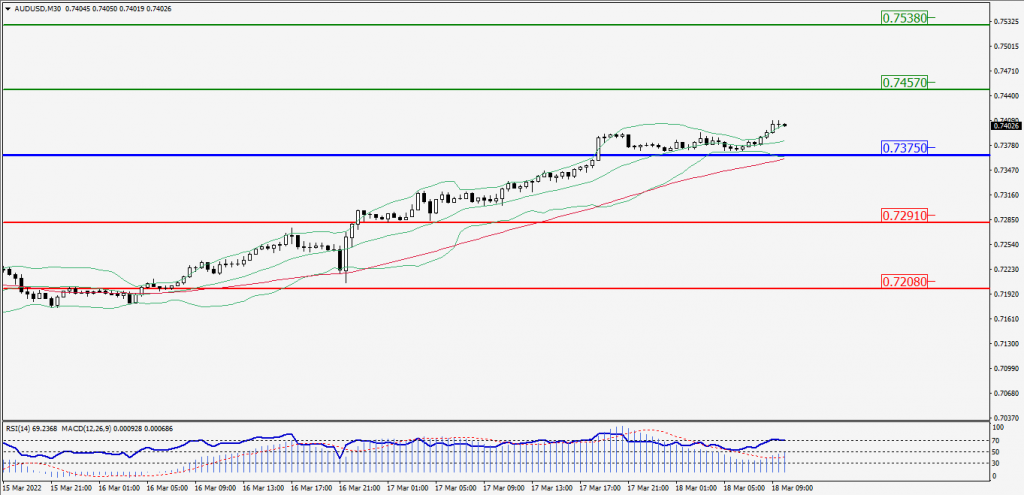
Green Lines Indicate Resistance Levels – Red Lines Indicates Support Levels
Light Blue is a Pivot Point – Black represents the price when the report was produced
CRUDEOIL Intraday: Trend on the Upside
Our pivot point is at 102.30
Preferable Price Action: Above pivots Buy Oil with 106.65 & 111.40 as targets.
Alternative Price Action: Sell crude Below pivot with targets at 97.75 and 93.00 in extension.
Comment: MACD is in the positive territory and Pair Above its 20MA & 55MA.
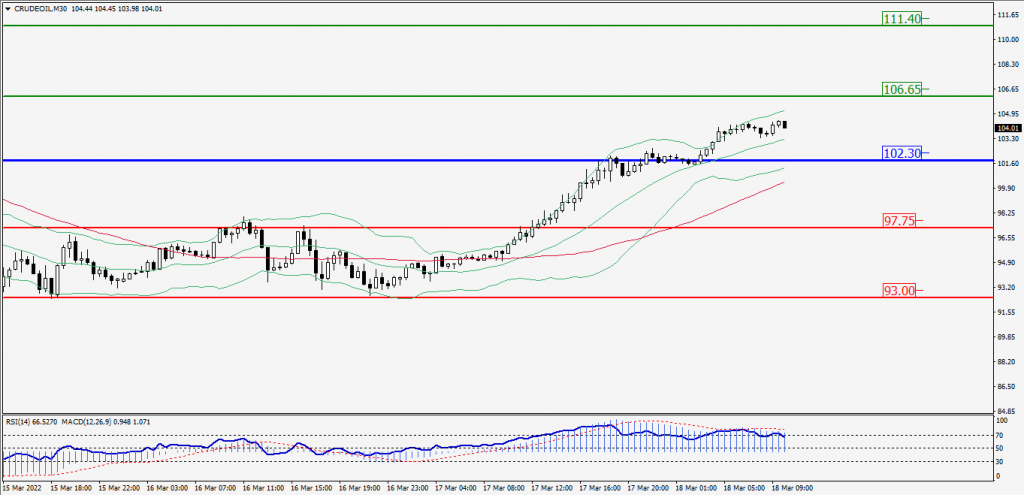
Green Lines Indicate Resistance Levels – Red Lines Indicates Support Levels
Light Blue is a Pivot Point – Black represents the price when the report was produced
XAU/USD Intraday: Resistance Level at 1950.90
Our pivot point is 1950.90
Preferable Price Action: Further Downside to 1925.30 and 1905.60.
Alternative Price Action: If the price gives an Upside breakout of a pivot, then the price extends to 1976.40 and 1995.80.
Comment: MACD is a negative territory and Pair Below its 20MA & 55MA.
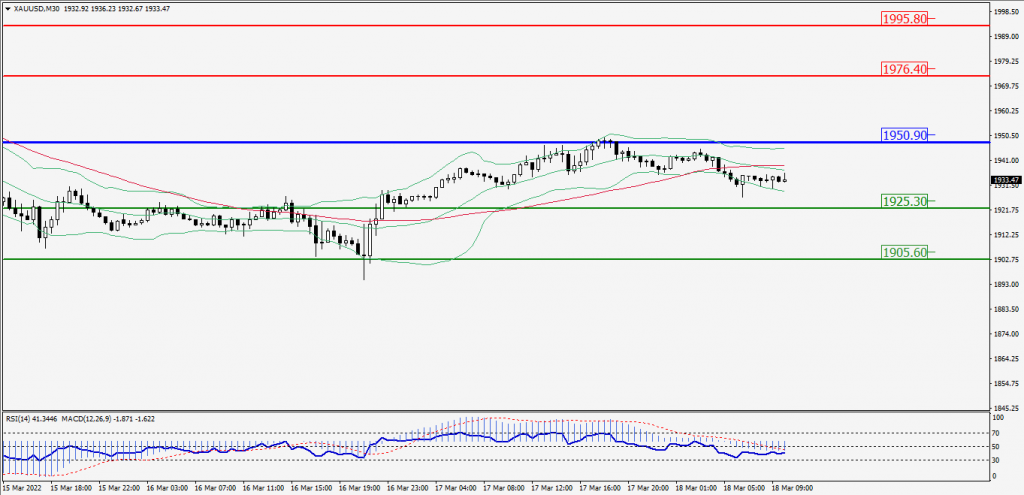
Green Lines Indicate Resistance Levels – Red Lines Indicates Support Levels
Light Blue is a Pivot Point – Black represents the price when the report was produced
Dow Jones Intraday: Trend on the Upside
Our pivot point is 34,133.00
Preferable Price Action: Take Long positions above pivot with targets at 34,567.00 & 34,985.00.
Alternative Price Action: below 34,133.00 looks for further downside to 33,690.00 & 33,257.00.
Comment: Price Above 55MA and RSI above 50 levels.
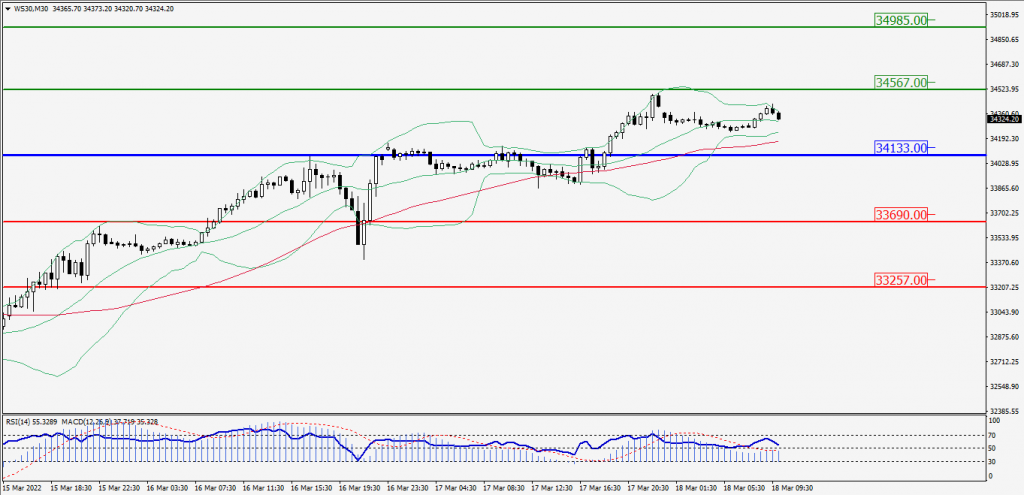
Green Lines Indicate Resistance Levels – Red Lines Indicates Support Levels
Light Blue is a Pivot Point – Black represents the price when the report was produced