Market Wrap: Stocks, Bonds, Commodities
The S&P 500 closed up more than 2 percent, while the Nasdaq rallied almost 4 percent on Wednesday, as investors shrugged off initial jitters following the US Federal Reserve’s interest rate increase and its signal that more hikes would be needed to fight inflation, ending the pandemic-era’s easy monetary policy.
The S&P 500 gain (2.24%) ended at 4,357.95 points, while the Nasdaq Composite accepted 3.77% to 13,436.55. The Dow Jones Industrial was rose 1.55% to 34,063.10.
MSCI’s index of Asia-Pacific stocks outside Japan is gained 3.95% to 715.89 levels. Australian index higher 1.05% to 7,250.80. Japanese Nikkei Index surged 3.46% to 26,652.89.
European stocks were Positive on Thursday, with the Stoxx Europe 50 Index up 0.43% to 3,906.25 Germany’s DAX collected 2.25% to 14,447.29, and France’s CAC rose 0.59% to 6,627.55, and U.K.’s FTSE 100 climbed 0.55% to 7,331.65.
Benchmark 10-year U.S. Treasury fell as demand for safe assets dropped again, today 10-year bond yields a negative 2.164.
Oil lost ground for the fifth time in the last six days on Wednesday as traders reacted to hoped-for progress in Russia-Ukraine peace talks and a surprising increase in US inventories.
Spot Brent crude oil gained 2.35% to $100.32 per barrel. US West Texas Intermediate crude up 2.21% to $97.14 a barrel.
The yellow metal gold is ascended 1.21% to 1,932.30 dollars per ounce.
Market Wrap: Forex
The yen was pinned to a six-year low on the dollar on Thursday, as a U.S. rate hike and hawkish outlook underscored just how far the Bank of Japan is likely to lag worldwide policy tightening, while stellar jobs data lifted the Australian dollar.
Today, the U.S. dollar index measures the Redback against a trade-weighted basket of six major currencies, which is fell 0.33% to 98.300.
The Euro US Dollar (EUR/USD) is a widely traded pair that is positive today. This left the pair trading around $1.10480.
The Japanese yen was positive against the U.S. dollar on Thursday as the stock up. Today USD/JPY is rose 0.09% to 118.820 level.
Another commodity-related currency positive against the U.S dollar, AUD/USD up 0.33% to 0.73130, and NZD/USD higher 0.13% to 0.68440 level.
EUR/USD Intraday: Trend on the Upside
Our pivot point is at 1.10060
Preferable Price Action: Take Long positions above pivot level with targets at 1.10840 & 1.11650 in extension.
Alternative Price Action: Below pivot looks for a further downside to 1.09250 & 1.08450.
Comment: RSI above 50 levels and Pair above 55MA.
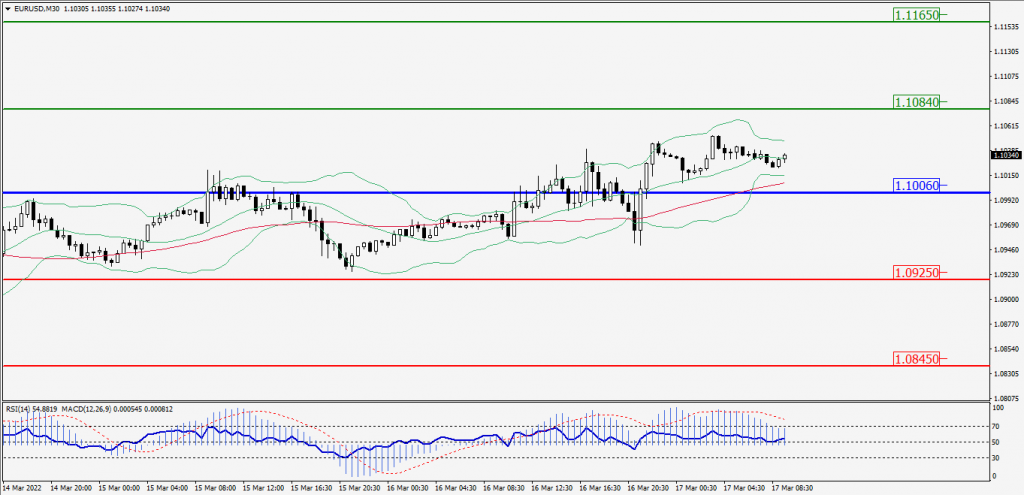
Green Lines Indicate Resistance Levels – Red Lines Indicates Support Levels
Light Blue is a Pivot Point – Black represents the price when the report was produced
GBP/USD Intraday: Support Level at 1.31460
Our pivot point is at 1.31460
Preferable Price Action: Buy positions Above pivot with targets at 1.32010 & 1.32540 in extension.
Alternative Price Action: The price Below pivot would call for further Downside to 1.30920 & 1.30380.
Comment: RSI above 50 levels and Pair above its 20MA & 55MA.
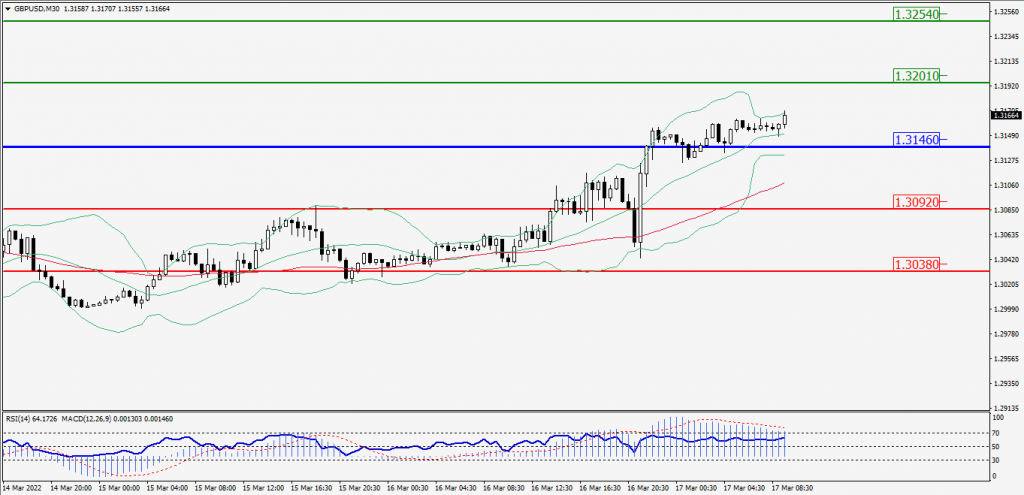
Green Lines Indicate Resistance Levels – Red Lines Indicates Support Levels
Light Blue is a Pivot Point – Black represents the price when the report was produced
USD/JPY Intraday: Support Level at 118.610
Our pivot point is at 118.610
Preferable Price Action: Buy position Above pivot with the target at 119.140 and 119.670 in extension.
Alternative Price Action: The Downside breakout of the pivot would call for 118.070 and 117.530.
Comment: MACD in Positive territory and Pair Above 55MA.
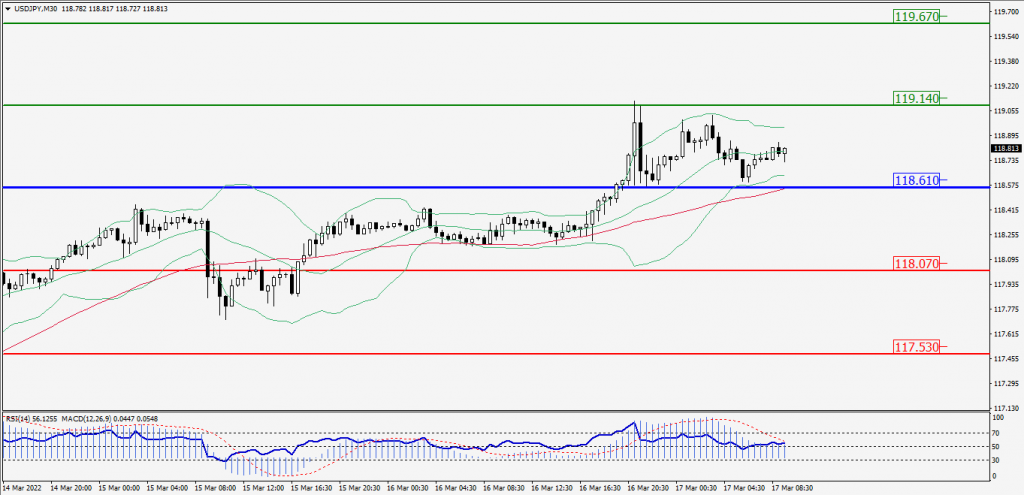
Green Lines Indicate Resistance Levels – Red Lines Indicates Support Levels
Light Blue is a Pivot Point – Black represents the price when the report was produced
AUD/USD Intraday: Trend on the Upside
Our pivot point is at 0.72930
Preferable Price Action: Buy Positions Above pivot with targets at 0.73410 & 0.73890 in extension.
Alternative Price Action: Below pivot looks for a further Downside with 0.72440 & 0.71980 as targets.
Comment: RSI above 50 levels and Pair Above its 20MA & 55MA.
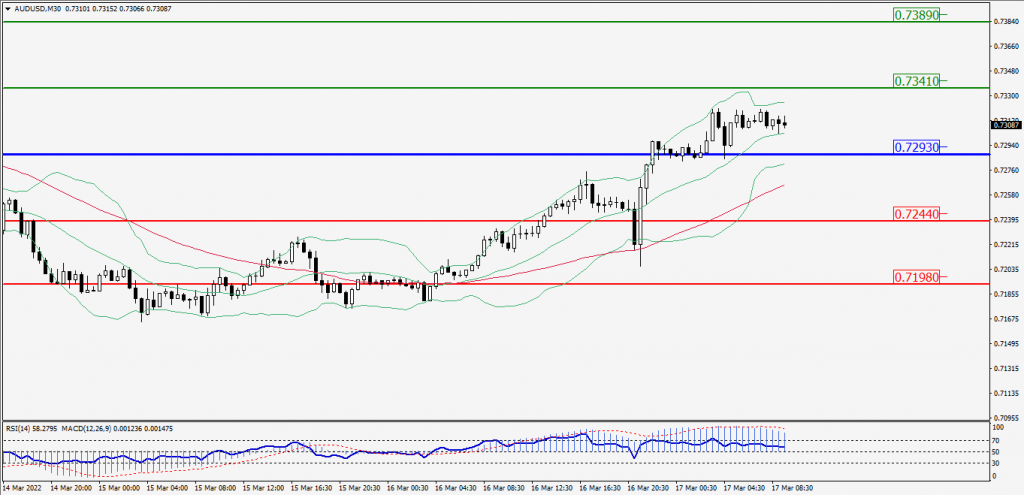
Green Lines Indicate Resistance Levels – Red Lines Indicates Support Levels
Light Blue is a Pivot Point – Black represents the price when the report was produced
CRUDEOIL Intraday: In a Consolidation Zone
Our pivot point is at 94.00
Preferable Price Action: Above pivots Buy Oil with 97.90 & 100.95 as targets.
Alternative Price Action: Sell crude Below pivot with targets at 90.05 and 87.00 in extension.
Comment: MACD is in the positive territory and Pair Above its 20MA & 55MA.
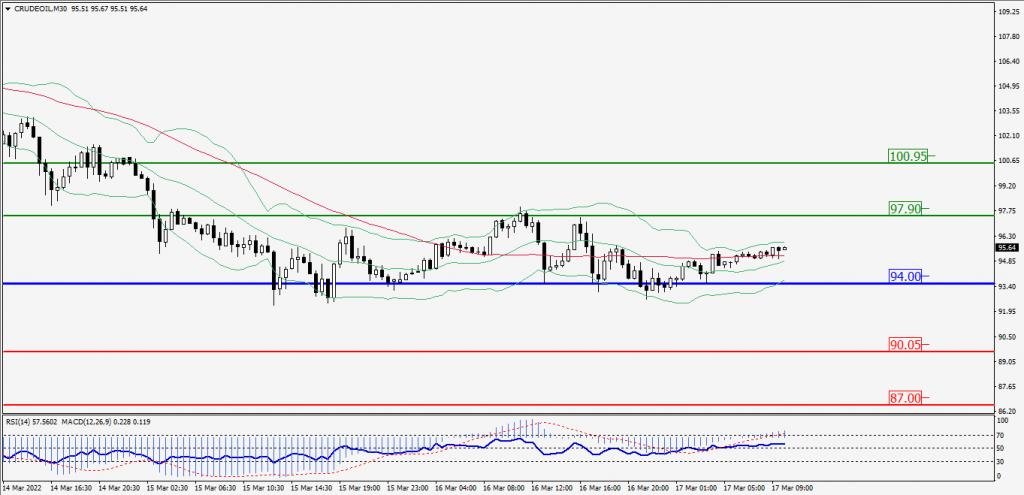
Green Lines Indicate Resistance Levels – Red Lines Indicates Support Levels
Light Blue is a Pivot Point – Black represents the price when the report was produced
XAU/USD Intraday: In a Consolidation Zone
Our pivot point is 1918.30
Preferable Price Action: Further Upside to 1952.70 and 1986.60.
Alternative Price Action: If the price gives a Downside breakout of a pivot, then the price extends to 1883.80 and 1849.30.
Comment: MACD is a positive territory and Pair Above 55MA.
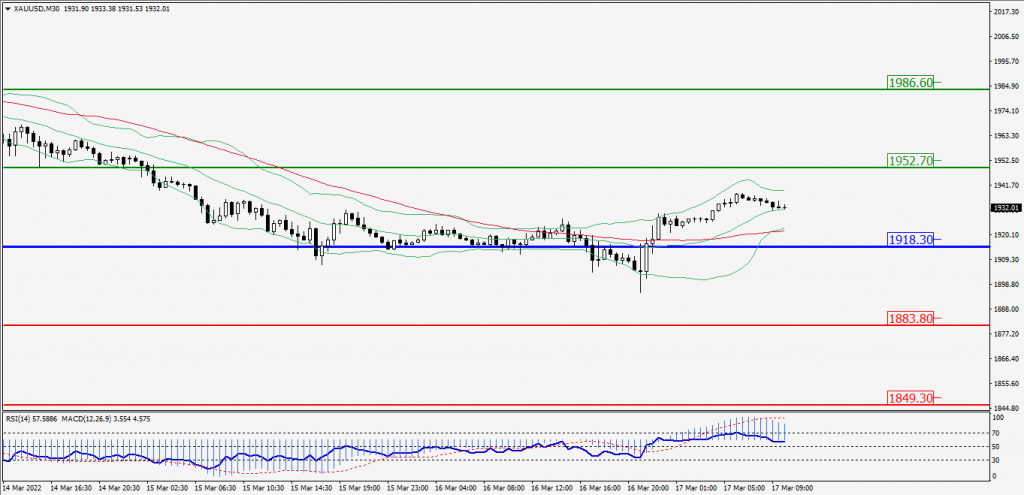
Green Lines Indicate Resistance Levels – Red Lines Indicates Support Levels
Light Blue is a Pivot Point – Black represents the price when the report was produced
Dow Jones Intraday: Trend on the Upside
Our pivot point is 33,925.00
Preferable Price Action: Take Long positions above pivot with targets at 34,392.00 & 34,748.00.
Alternative Price Action: below 33,925.00 looks for further downside to 33,471.00 & 33,102.00.
Comment: Price Above 55MA and RSI above 50 levels.
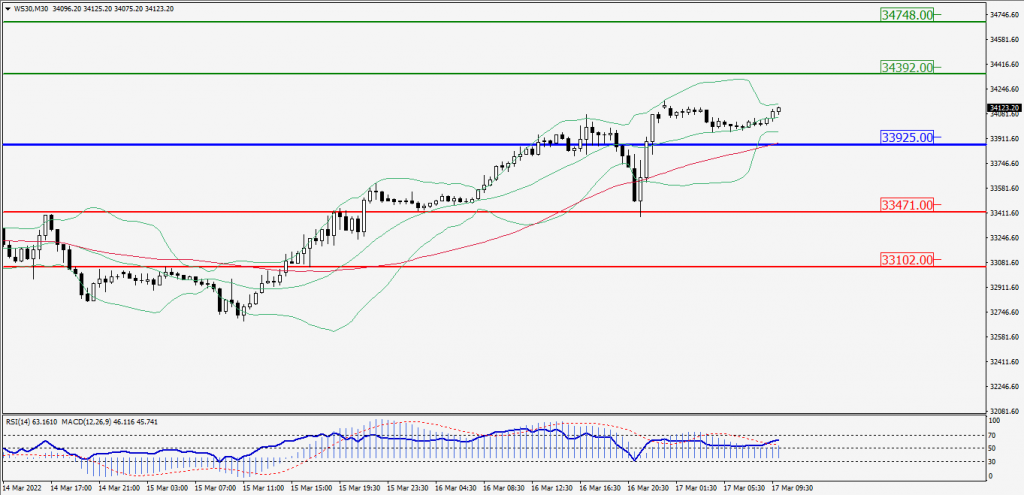
Green Lines Indicate Resistance Levels – Red Lines Indicates Support Levels
Light Blue is a Pivot Point – Black represents the price when the report was produced