Market Wrap: Stocks, Bonds, Commodities
The S&P 500 ended down slightly on July 14, with bank and financial shares mostly lower on the day following quarterly reports that kicked off earnings season, but all three major US stock indexes posted solid weekly gains.
The Dow Jones Industrial Average rose 113.89 points to 34,509.02, the S&P 500 lose 0.10% to 4,505.42 and the Nasdaq Composite subtract 24.87 points to 14,113.70.
MSCI’s index of Asia-Pacific stocks outside Japan is decline 0.10% to 655.38 levels. The Australian index was lower by 0.06% to 7,298.50. Japanese Nikkei Index decline 0.09% today.
European stocks were negative on Monday, with the Stoxx Europe 50 Index fell 0.85% to 4,362.75, Germany’s DAX decline 0.38% to 16,044.45, and France’s CAC drop 1.04% to 7,297.58 and U.K.’s FTSE 100 subtract 0.18% to 7,421.24.
Benchmark 10-year U.S. Treasury fell a0s demand for safe assets ascend again, today 10-year bond yields negative 0.50% to 3.8000.
Oil prices dipped for a second session on Monday after Libya resumed production over the weekend while China, the world’s largest crude importer, is expected to release economic data showing that its post-pandemic recovery is fizzling out.
Spot Brent crude oil ascend 0.16% to $80.00 per barrel. US West Texas Intermediate crude is up 0.13% to $75.41 a barrel.
The yellow metal gold is decline 0.30% to 1,958.55 dollars per ounce.
Market Wrap: Forex
A bruised dollar took respite on Monday after suffering its worst weekly drop of the year, as traders waited on economic data and policy decisions before selling it down any further.
Today, the U.S. dollar index measures the Greenback against a trade-weighted basket of six major currencies, which slipped 0.10% to 99.500.
The Euro US Dollar (EUR/USD) is a widely traded pair that is up 0.13% today. This left the pair trading around $1.12420.
The Japanese yen was negative against the U.S. dollar on Monday. Today USD/JPY is slipped 0.21% to the 138.440 level.
Another commodity-related currency negative against the U.S dollar, AUD/USD fell 0.32% to 0.68140, and NZD/USD slipped 0.42% to 0.63410 level.
EUR/USD Intraday: Major support level at 1.12260
Our pivot point is at 1.12260
Preferable Price Action: Take buy positions above pivot level with targets at 1.12770 & 1.13110 in extension.
Alternative Price Action: Below pivot looks for a further downside to 1.11790 & 1.11450.
Comment: RSI is above 50 levels and Pairs above its 20MA & 55MA.
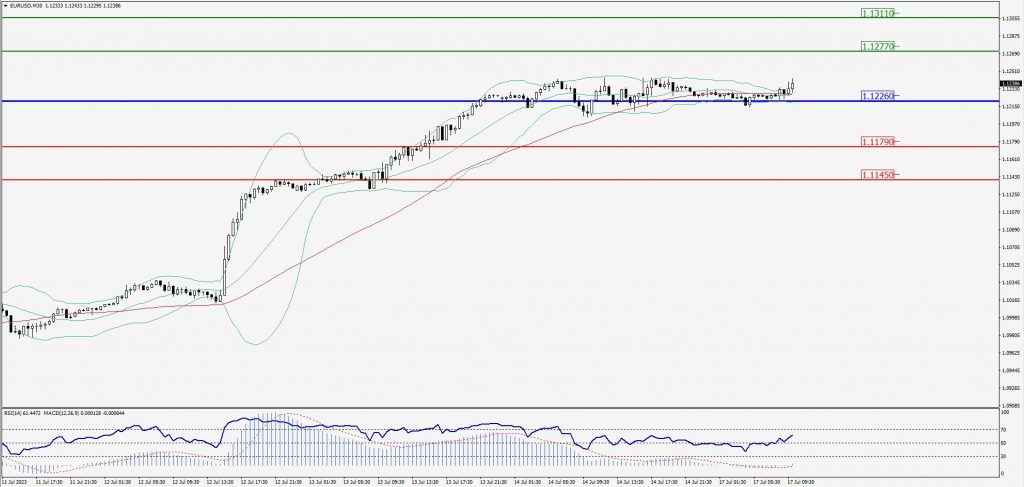
Green Lines Indicate Resistance Levels – Red Lines Indicate Support Levels
Light Blue is a Pivot Point – Black represents the price when the report was produced
GBP/USD Intraday: Resistance level at 1.31000
Our pivot point is at 1.31000
Preferable Price Action: Sell positions below pivot with targets at 1.30570 & 1.30260 in extension.
Alternative Price Action: The price above pivot would call for further upside to 1.31430 & 1.31740.
Comment: RSI is below 50 levels and Pairs below 55MA.
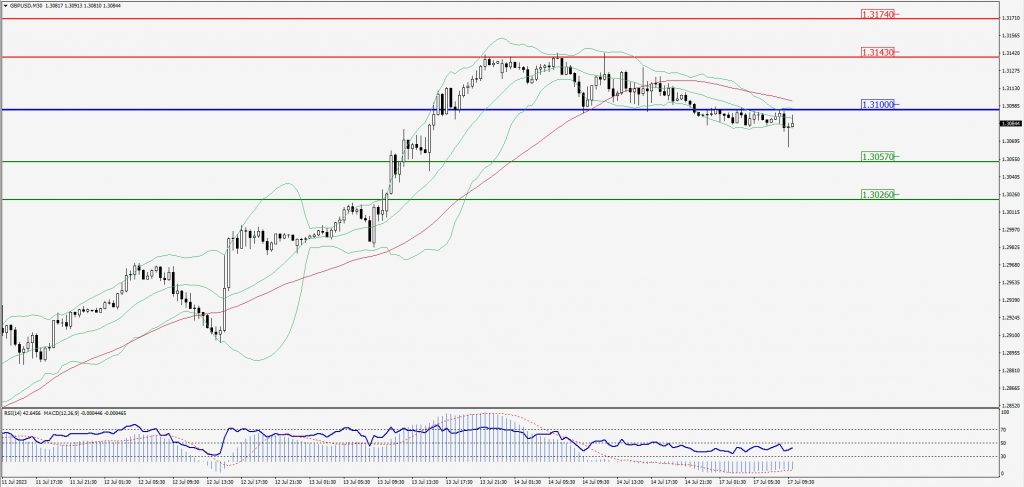
Green Lines Indicate Resistance Levels – Red Lines Indicate Support Levels
Light Blue is a Pivot Point – Black represents the price when the report was produced
USD/JPY Intraday: In a consolidation zone
Our pivot point is at 138.430
Preferable Price Action: Buy position above pivot with the target at 139.300 and 139.890 in extension.
Alternative Price Action: The downside breakout of the pivot would call for 137.730 and 137.130.
Comment: MACD is at 50 level.
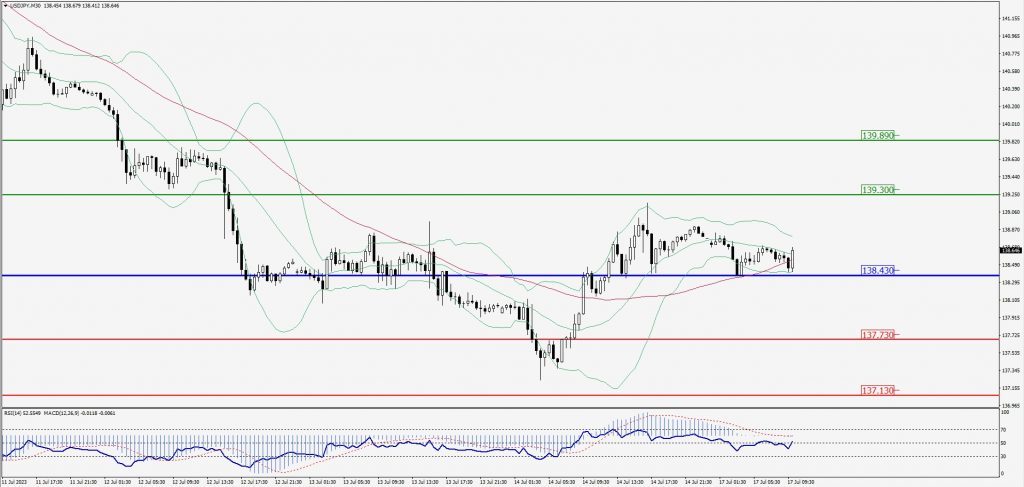
Green Lines Indicate Resistance Levels – Red Lines Indicate Support Levels
Light Blue is a Pivot Point – Black represents the price when the report was produced
AUD/USD Intraday: Major trend on the upside
Our pivot point is at 0.68290
Preferable Price Action: Sell positions below pivot with targets at 0.67860 & 0.67590 in extension.
Alternative Price Action: Above pivot looks for a further upside with 0.68700 & 0.68990 as targets.
Comment: RSI is below 50 levels and Pairs below its 20MA & 55MA.
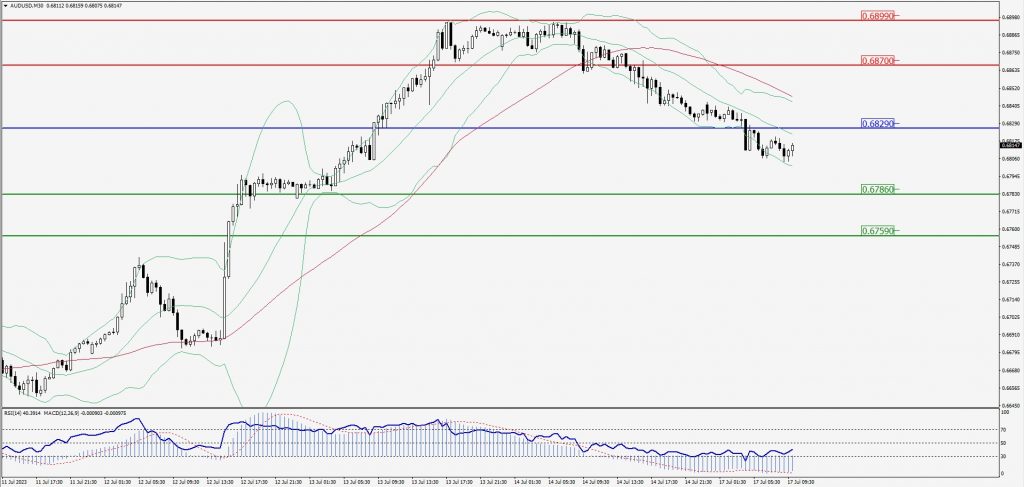
Green Lines Indicate Resistance Levels – Red Lines Indicate Support Levels
Light Blue is a Pivot Point – Black represents the price when the report was produced
CRUDEOIL Intraday: Trend on the downside
Our pivot point is at 74.90
Preferable Price Action: Below pivot sell oil with 74.12 & 73.59 as targets.
Alternative Price Action: Buy crude above pivot with targets at 75.53 and 75.99 in extension.
Comment: MACD is negative territory and Pairs below its 20MA & 55MA.
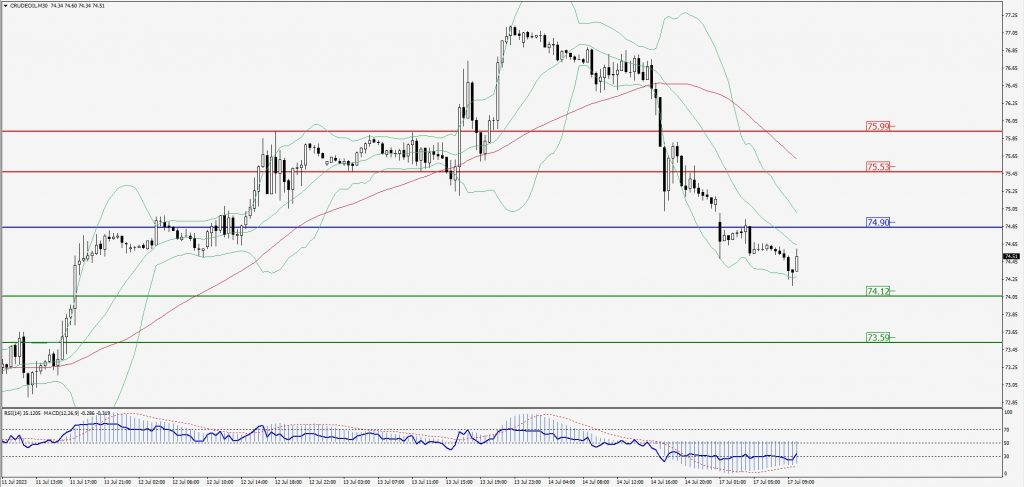
Green Lines Indicate Resistance Levels – Red Lines Indicate Support Levels
Light Blue is a Pivot Point – Black represents the price when the report was produced
XAU/USD Intraday: Trend on the downside
Our pivot point is 1955.90
Preferable Price Action: Further downside to 1947.30 and 1941.90.
Alternative Price Action: If the price gives an upside breakout of a pivot, then the price extends to 1964.10 and 1970.30.
Comment: MACD is below 50 level and Pairs below 55MA.
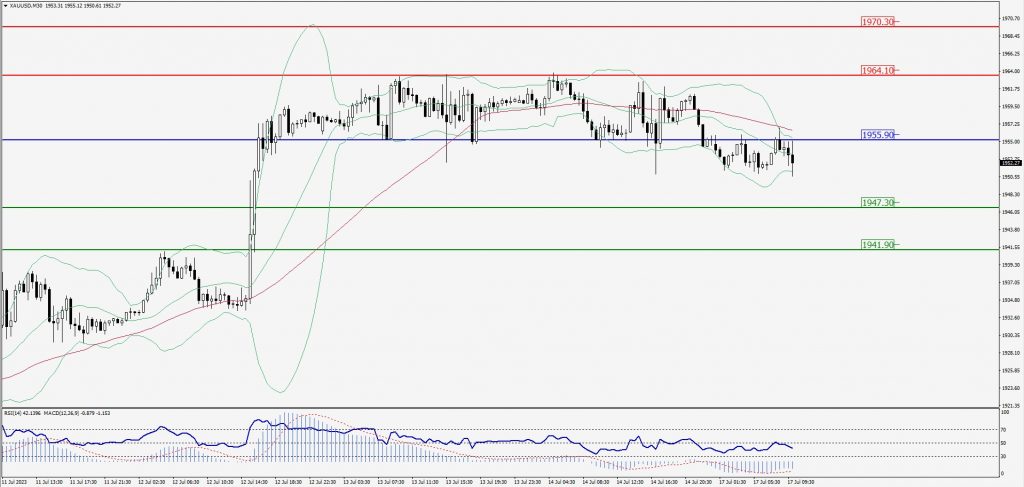
Green Lines Indicate Resistance Levels – Red Lines Indicate Support Levels
Light Blue is a Pivot Point – Black represents the price when the report was produced
Dow Jones Intraday: In a consolidation zone
Our pivot point is 34,440.00
Preferable Price Action: Take buy positions above the pivot with targets at 34,559.00 & 34,645.00.
Alternative Price Action: Below 34,440.00 looks for further downside to 34,325.00 & 34,239.00.
Comment: RSI is above 50 levels.
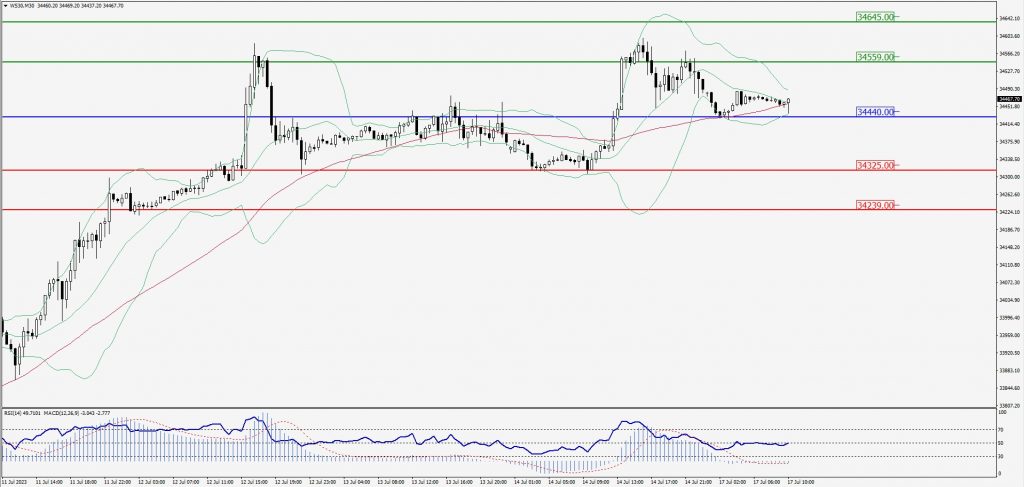
Green Lines Indicate Resistance Levels – Red Lines Indicate Support Levels
Light Blue is a Pivot Point – Black represents the price when the report was produced