Market Wrap: Stocks, Bonds, Commodities
U.S. stocks extended recent gains to end higher on Thursday, with the Nasdaq rising more than 1% for a second straight day, as data showed the annual increase in U.S. producer inflation was the smallest in nearly three years.
The Dow Jones Industrial Average rose 47.71 points to 34,395.14, the S&P 500 gain 0.85% to 4,510.04 and the Nasdaq Composite add 219.61 points to 14,138.57.
MSCI’s index of Asia-Pacific stocks outside Japan is advance 0.98% to 656.08 levels. The Australian index was higher by 0.78% to 7,303.10. Japanese Nikkei Index decline 0.09% today.
European stocks were mixed on Friday, with the Stoxx Europe 50 Index rose 0.17% to 4,399.35, Germany’s DAX decline 0.43% to 16,106.38, and France’s CAC ascend 0.29% to 7,390.45 and U.K.’s FTSE 100 add 0.10% to 7,447.81.
Benchmark 10-year U.S. Treasury fell a0s demand for safe assets ascend again, today 10-year bond yields positive 1.10% to 3.8000.
Oil prices rose on Friday on support from tighter supply amid issues in Libya and Nigeria and easing U.S. inflation, which markets hope may bring an end to interest rate hikes in the world’s biggest economy.
Spot Brent crude oil drop 0.18% to $81.21 per barrel. US West Texas Intermediate crude is down 0.23% to $76.73 a barrel.
The yellow metal gold is decline 0.16% to 1,960.55 dollars per ounce.
Market Wrap: Forex
The dollar slumped to its lowest since April 2022 on Thursday, as cooling U.S. inflation bolstered expectations that the Federal Reserve would hike interest rates just one more time this year, eroding the greenback’s yield advantage over peers.
Today, the U.S. dollar index measures the Greenback against a trade-weighted basket of six major currencies, which slipped 0.08% to 99.360.
The Euro US Dollar (EUR/USD) is a widely traded pair that is up 0.17% today. This left the pair trading around $1.12420.
The Japanese yen was negative against the U.S. dollar on Friday. Today USD/JPY is surged 0.14% to the 138.230 level.
Another commodity-related currency negative against the U.S dollar, AUD/USD fell 0.13% to 0.68780, and NZD/USD slipped 0.18% to 0.63780 level.
EUR/USD Intraday: Trend on the upside
Our pivot point is at 1.12130
Preferable Price Action: Take buy positions above pivot level with targets at 1.12860 & 1.13350 in extension.
Alternative Price Action: Below pivot looks for a further downside to 1.11470 & 1.11000.
Comment: RSI is above 50 levels and Pairs above 55MA.
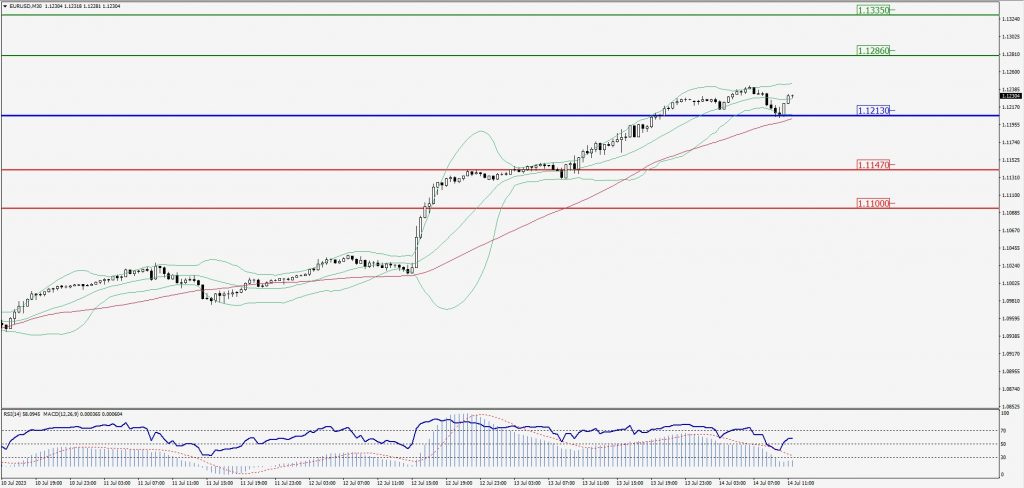
Green Lines Indicate Resistance Levels – Red Lines Indicate Support Levels
Light Blue is a Pivot Point – Black represents the price when the report was produced
GBP/USD Intraday: In a consolidation zone
Our pivot point is at 1.31050
Preferable Price Action: Buy positions above pivot with targets at 1.31850 & 1.32420 in extension.
Alternative Price Action: The price below pivot would call for further downside to 1.30350 & 1.29860.
Comment: RSI is above 50 levels and Pairs above 55MA.
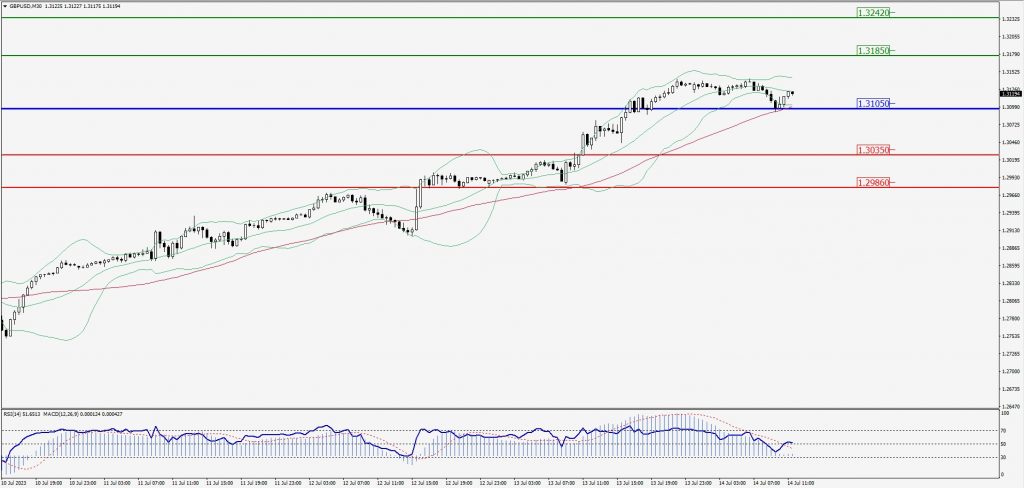
Green Lines Indicate Resistance Levels – Red Lines Indicate Support Levels
Light Blue is a Pivot Point – Black represents the price when the report was produced
USD/JPY Intraday: Trend on the upside
Our pivot point is at 137.870
Preferable Price Action: Buy position above pivot with the target at 139.000 and 139.680 in extension.
Alternative Price Action: The downside breakout of the pivot would call for 136.940 and 136.280.
Comment: MACD is above 50 level and Pairs above 20MA.
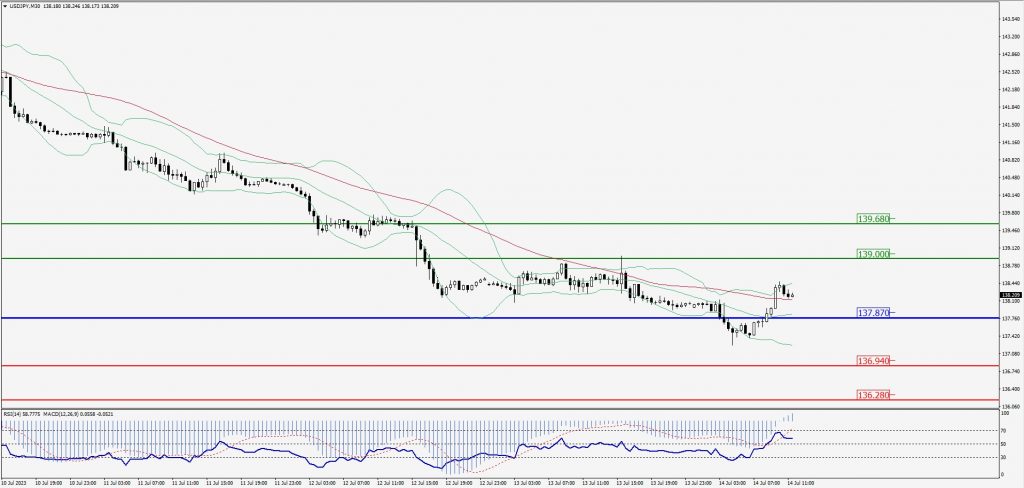
Green Lines Indicate Resistance Levels – Red Lines Indicate Support Levels
Light Blue is a Pivot Point – Black represents the price when the report was produced
AUD/USD Intraday: Resistance level at 0.69000
Our pivot point is at 0.69000
Preferable Price Action: Sell positions below pivot with targets at 0.68520 & 0.68210 in extension.
Alternative Price Action: Above pivot looks for a further upside with 0.69420 & 0.69750 as targets.
Comment: RSI is below 50 levels and Pairs below 20MA.
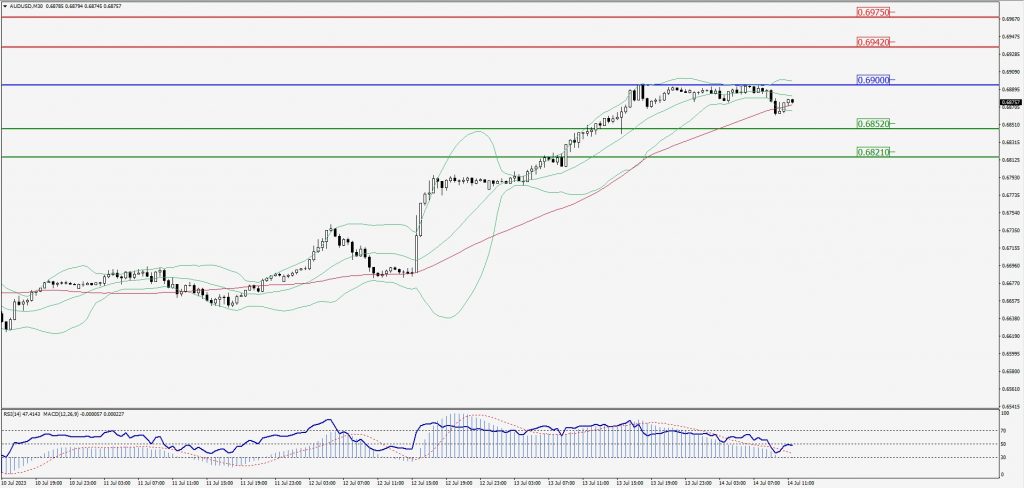
Green Lines Indicate Resistance Levels – Red Lines Indicate Support Levels
Light Blue is a Pivot Point – Black represents the price when the report was produced
CRUDEOIL Intraday: In a consolidation zone
Our pivot point is at 76.28
Preferable Price Action: Above pivot buy oil with 77.29 & 78.03 as targets.
Alternative Price Action: Sell crude below pivot with targets at 75.43 and 74.80 in extension.
Comment: MACD is positive territory and Pairs above 55MA.
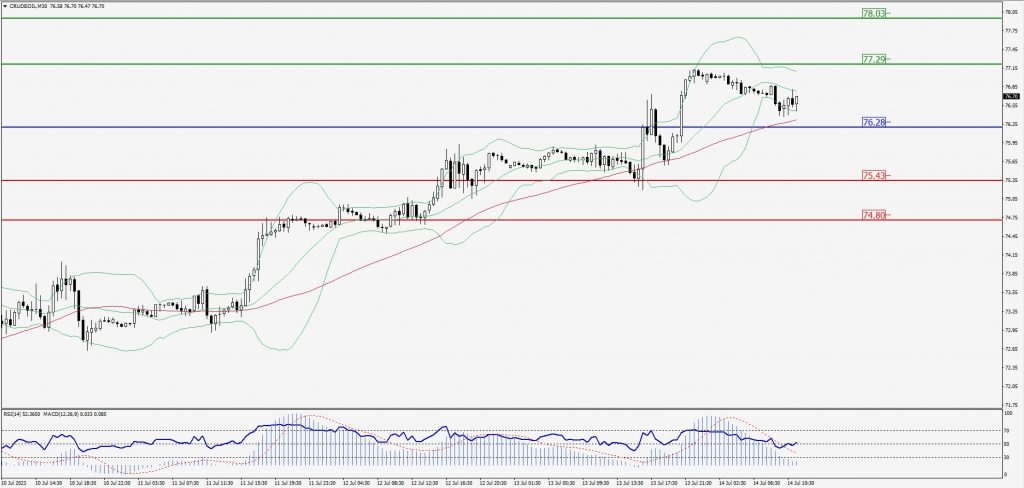
Green Lines Indicate Resistance Levels – Red Lines Indicate Support Levels
Light Blue is a Pivot Point – Black represents the price when the report was produced
XAU/USD Intraday: Major resistance level at 1961.70
Our pivot point is 1961.70
Preferable Price Action: Further downside to 1949.80 and 1941.20.
Alternative Price Action: If the price gives an upside breakout of a pivot, then the price extends to 1972.80 and 1981.30.
Comment: MACD is below 50 level and Pairs below its 20MA & 55MA.
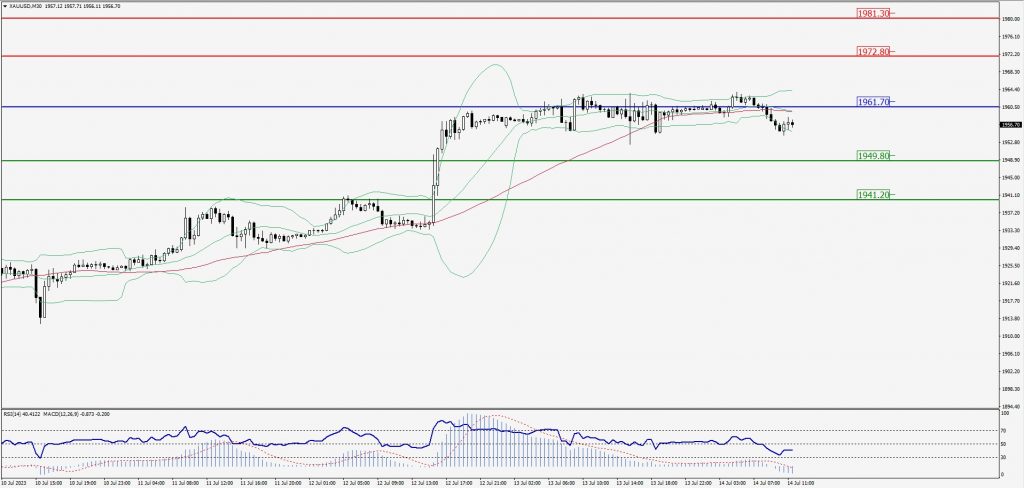
Green Lines Indicate Resistance Levels – Red Lines Indicate Support Levels
Light Blue is a Pivot Point – Black represents the price when the report was produced
Dow Jones Intraday: Trend on the upside
Our pivot point is 34,328.00
Preferable Price Action: Take buy positions above the pivot with targets at 34,476.00 & 34,592.00.
Alternative Price Action: Below 34,328.00 looks for further downside to 34,191.00 & 34,090.00.
Comment: RSI is above 50 levels and Pairs above 20MA.
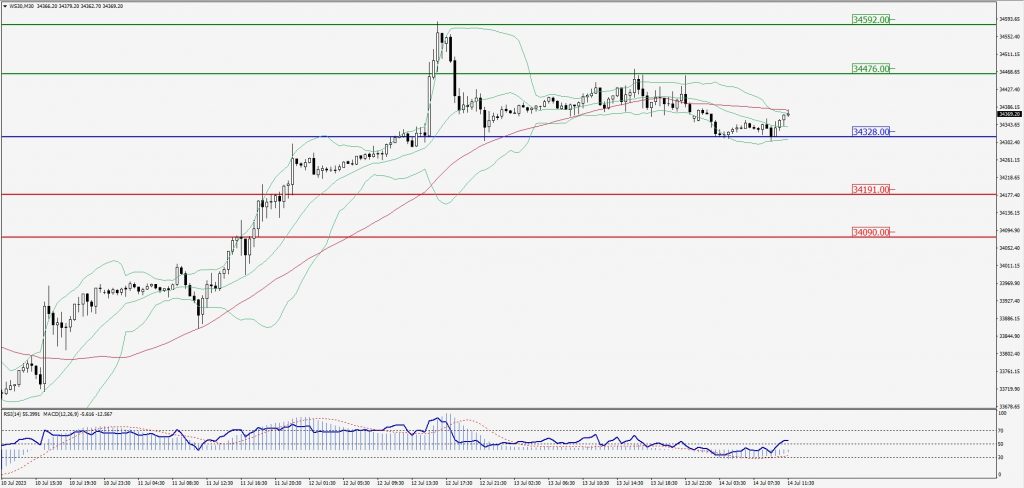
Green Lines Indicate Resistance Levels – Red Lines Indicate Support Levels
Light Blue is a Pivot Point – Black represents the price when the report was produced