Market Wrap: Stocks, Bonds, Commodities
U.S. stock futures were little changed on Monday evening, as all eyes on Wall Street turn to a Tuesday meeting between congressional leaders and President Joe Biden.
The Dow Jones Industrial Average rose 47.98 points to 33,348.60, the S&P 500 gain 0.30% to 4,136.28 and the Nasdaq Composite add 80.47 points to 12,365.21.
MSCI’s index of Asia-Pacific stocks outside Japan is advance 0.34% to 631.82 levels. The Australian index was lower by 0.45% to 7,234.70. Japanese Nikkei Index advance 0.73% today.
European stocks were mixed on Tuesday, with the Stoxx Europe 50 Index fell 0.06% to 4,318.95, Germany’s DAX advance 0.10% to 15,932.95, and France’s CAC drop 0.06% to 7,414.46 and U.K.’s FTSE 100 add 0.15% to 7,789.05.
Benchmark 10-year U.S. Treasury fell as demand for safe assets ascend again, today 10-year bond yields negative 0.97% to 3.4740.
Oil prices rose a dollar a barrel on Monday after three straight sessions of declines, boosted by the prospect of tightening supplies in Canada and elsewhere, although recession fears kept pressuring the market.
Spot Brent crude oil ascend 0.09% to $75.29 per barrel. US West Texas Intermediate crude is up 0.08% to $71.17 a barrel.
The yellow metal gold is decline 0.43% to 2,014.00 dollars per ounce.
Market Wrap: Forex
The U.S. dollar stabilized in early European trade Tuesday, just off a five-week high helped by its safe haven status as the standoff in Washington over the U.S. debt ceiling continued.
Today, the U.S. dollar index measures the Greenback against a trade-weighted basket of six major currencies, which slipped 0.13% to 102.130.
The Euro US Dollar (EUR/USD) is a widely traded pair that is up 0.17% today. This left the pair trading around $1.08920.
The Japanese yen was negative against the U.S. dollar on Tuesday. Today USD/JPY is slipped 0.20% to the 135.850 level.
Another commodity-related currency mixed against the U.S dollar, AUD/USD fell 0.21% to 0.66870, and NZD/USD surged 0.13% to 0.62470 level.
EUR/USD Intraday: Resistance level at 1.08880
Our pivot point is at 1.08880
Preferable Price Action: Take sell positions below pivot level with targets at 1.08480 & 1.08260 in extension.
Alternative Price Action: Above pivot looks for a further upside to 1.09220 & 1.09490.
Comment: RSI is below 50 levels and Pairs below 20MA.
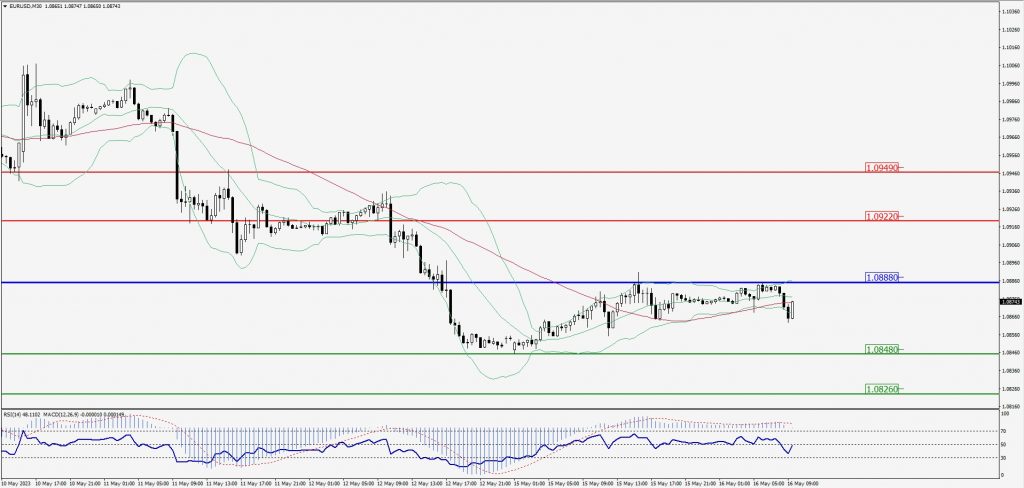
Green Lines Indicate Resistance Levels – Red Lines Indicate Support Levels
Light Blue is a Pivot Point – Black represents the price when the report was produced
GBP/USD Intraday: Major trend on the downside
Our pivot point is at 1.25020
Preferable Price Action: Sell positions below pivot with targets at 1.24450 & 1.24140 in extension.
Alternative Price Action: The price above pivot would call for further upside to 1.25480 & 1.25840.
Comment: RSI is below 50 levels and Pairs below its 20MA & 55MA.
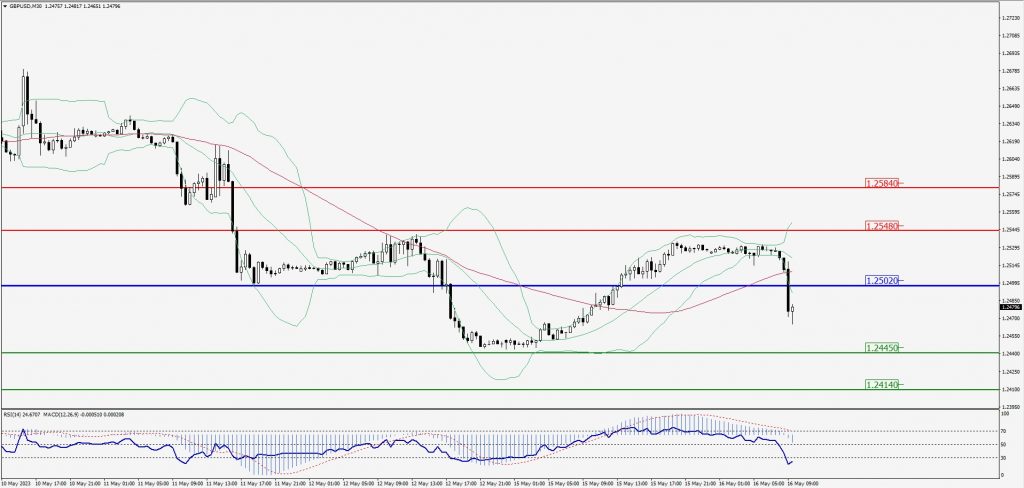
Green Lines Indicate Resistance Levels – Red Lines Indicate Support Levels
Light Blue is a Pivot Point – Black represents the price when the report was produced
USD/JPY Intraday: Major resistance level at 136.100
Our pivot point is at 136.100
Preferable Price Action: Sell position below pivot with the target at 135.640 and 135.340 in extension.
Alternative Price Action: The upside breakout of the pivot would call for 136.540 and 136.850.
Comment: MACD is below 50 level and Pairs below 55MA.
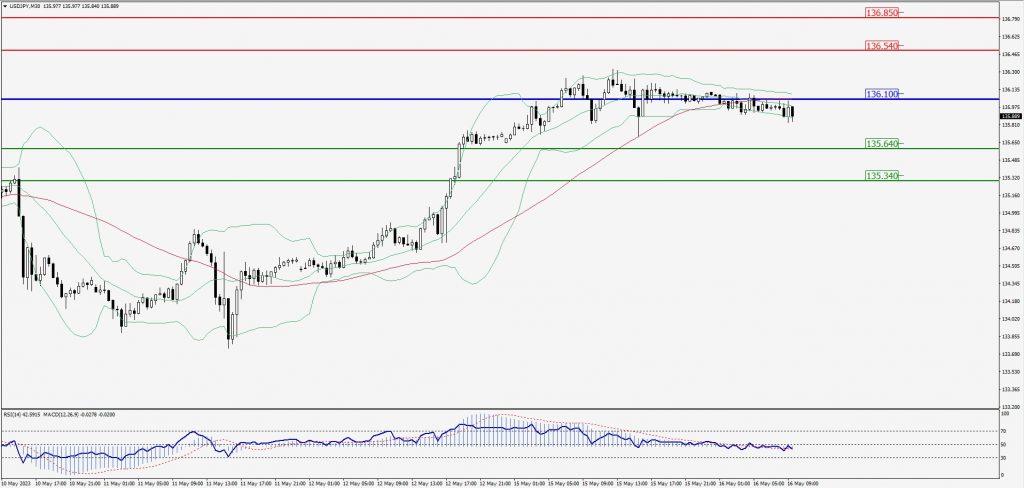
Green Lines Indicate Resistance Levels – Red Lines Indicate Support Levels
Light Blue is a Pivot Point – Black represents the price when the report was produced
AUD/USD Intraday: Trend on the downside
Our pivot point is at 0.66920
Preferable Price Action: Sell positions below pivot with targets at 0.66470 & 0.66210 in extension.
Alternative Price Action: Above pivot looks for a further upside with 0.67300 & 0.67570 as targets.
Comment: RSI is below 50 levels and Pairs below its 20MA & 55MA.
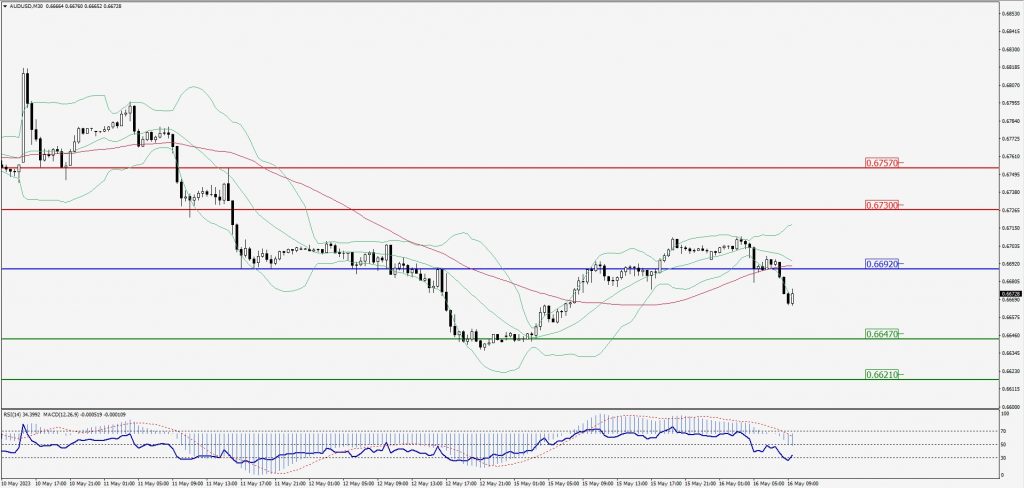
Green Lines Indicate Resistance Levels – Red Lines Indicate Support Levels
Light Blue is a Pivot Point – Black represents the price when the report was produced
CRUDEOIL Intraday: Trend on the downside
Our pivot point is at 71.39
Preferable Price Action: Below pivot sell oil with 70.61 & 770.10 as targets.
Alternative Price Action: Buy crude above pivot with targets at 72.04 and 72.57 in extension.
Comment: MACD is negative territory and Pairs below 20MA.
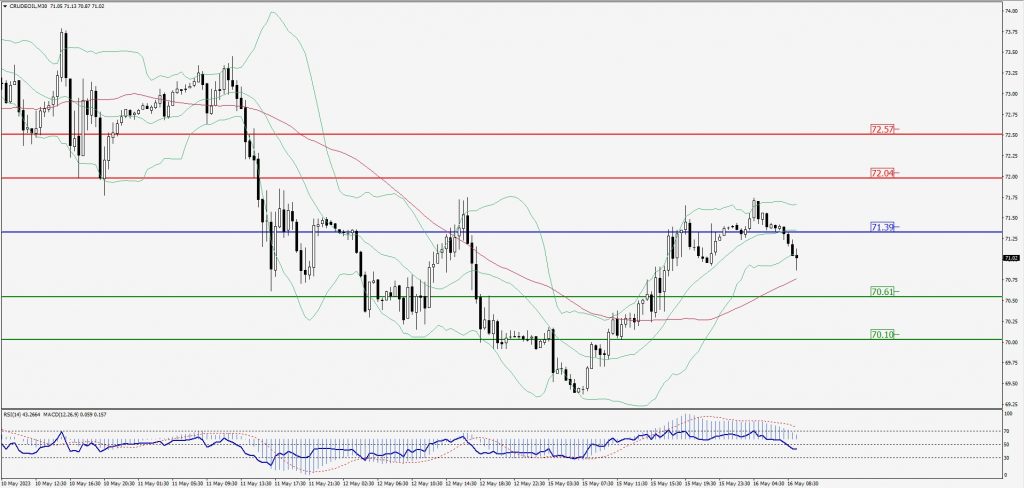
Green Lines Indicate Resistance Levels – Red Lines Indicate Support Levels
Light Blue is a Pivot Point – Black represents the price when the report was produced
XAU/USD Intraday: Major trend on the downside
Our pivot point is 2011.60
Preferable Price Action: Further dwonside to 2002.30 and 1996.40
Alternative Price Action: If the price gives an upside breakout of a pivot, then the price extends to 2020.70 and 2027.30.
Comment: MACD is below 50 level and Pairs below its 20MA & 55MA.
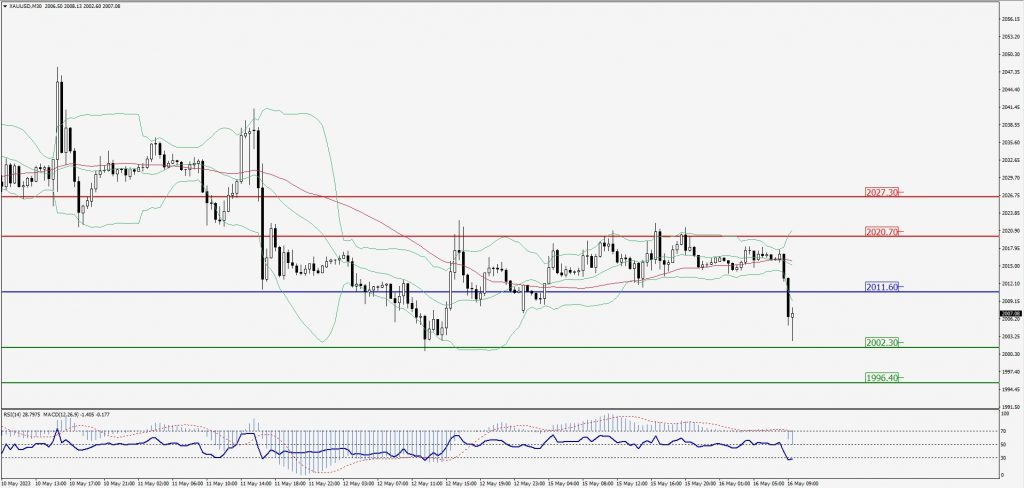
Green Lines Indicate Resistance Levels – Red Lines Indicate Support Levels
Light Blue is a Pivot Point – Black represents the price when the report was produced
Dow Jones Intraday: Trend on the downside
Our pivot point is 33,309.00
Preferable Price Action: Take sell positions below the pivot with targets at 33,188.00 & 33,109.00.
Alternative Price Action: Above 33,309.00 looks for further upside to 33,423.00 & 33,515.00.
Comment: RSI is below 50 levels and Pairs below its 20MA & 55MA.
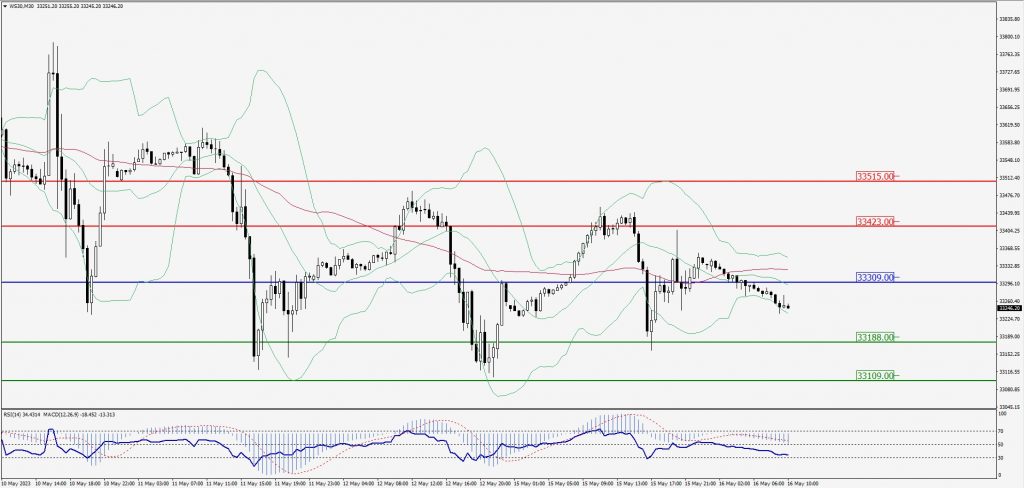
Green Lines Indicate Resistance Levels – Red Lines Indicate Support Levels
Light Blue is a Pivot Point – Black represents the price when the report was produced