Market Wrap: Stocks, Bonds, Commodities
Australia stocks were higher after the close on Monday, as gains in the Gold, A-REITs and Metals & Mining sectors led shares higher.
The Dow Jones Industrial Average fell 8.89 points to 33,300.62, the S&P 500 lose 0.16% to 4,124.08 and the Nasdaq Composite subtract 43.76 points to 12,284.74.
MSCI’s index of Asia-Pacific stocks outside Japan is advance 0.72% to 629.22 levels. The Australian index was higher by 0.14% to 7,267.10. Japanese Nikkei Index advance 0.81% today.
European stocks were positive on Monday, with the Stoxx Europe 50 Index rose 0.18% to 4,325.85, Germany’s DAX advance 0.12% to 15,933.65, and France’s CAC ascend 0.12% to 7,444.77 and U.K.’s FTSE 100 add 0.27% to 7,775.32.
Benchmark 10-year U.S. Treasury fell as demand for safe assets ascend again, today 10-year bond yields positive 0.20% to 3.4700.
Oil prices settled more than 1 percent lower on Friday, falling for the third consecutive week, as the market balanced supply fears against renewed economic concerns in the United States and China.
Spot Brent crude oil ascend 0.05% to $74.21 per barrel. US West Texas Intermediate crude is up 0.14% to $70.14 a barrel.
The yellow metal gold is advance 0.06% to 2,021.00 dollars per ounce.
Market Wrap: Forex
The U.S. dollar fell slightly from a five-week high on Monday after a period of strength that has confused analysts.
Today, the U.S. dollar index measures the Greenback against a trade-weighted basket of six major currencies, which slipped 0.04% to 102.460.
The Euro US Dollar (EUR/USD) is a widely traded pair that is up 0.09% today. This left the pair trading around $1.08590.
The Japanese yen was negative against the U.S. dollar on Monday. Today USD/JPY is surged 0.31% to the 136.120 level.
Another commodity-related currency positive against the U.S dollar, AUD/USD rose 0.51% to 0.66800, and NZD/USD surged 0.44% to 0.62150 level.
EUR/USD Intraday: Support level at 1.08570
Our pivot point is at 1.08570
Preferable Price Action: Take buy positions above pivot level with targets at 1.09020 & 1.09350 in extension.
Alternative Price Action: Below pivot looks for a further downside to 1.08180 & 1.07890.
Comment: RSI is above 50 levels and Pairs above 55MA.
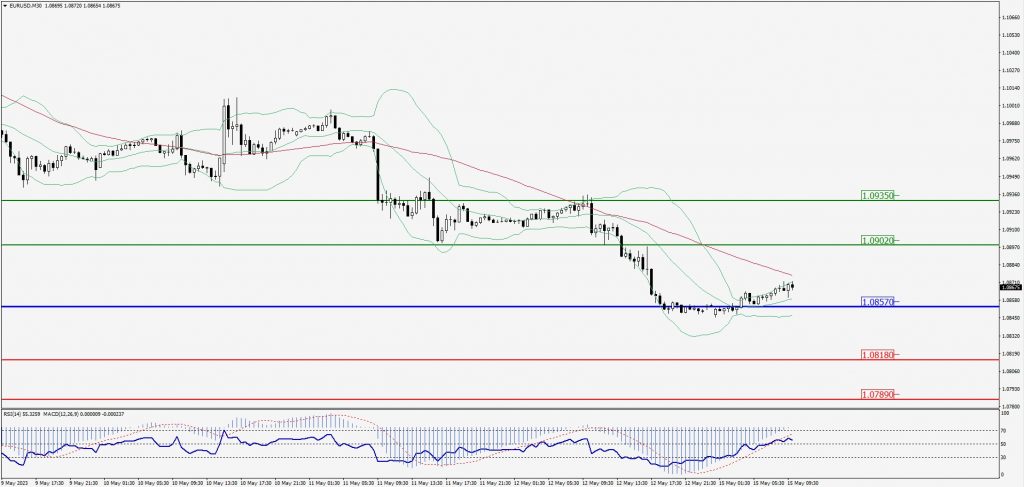
Green Lines Indicate Resistance Levels – Red Lines Indicate Support Levels
Light Blue is a Pivot Point – Black represents the price when the report was produced
GBP/USD Intraday: Support level at 1.24580
Our pivot point is at 1.24580
Preferable Price Action: Buy positions above pivot with targets at 1.25080 & 1.25500 in extension.
Alternative Price Action: The price below pivot would call for further downside to 1.24150 & 1.23790.
Comment: RSI is above 50 levels and Pairs above 20MA.
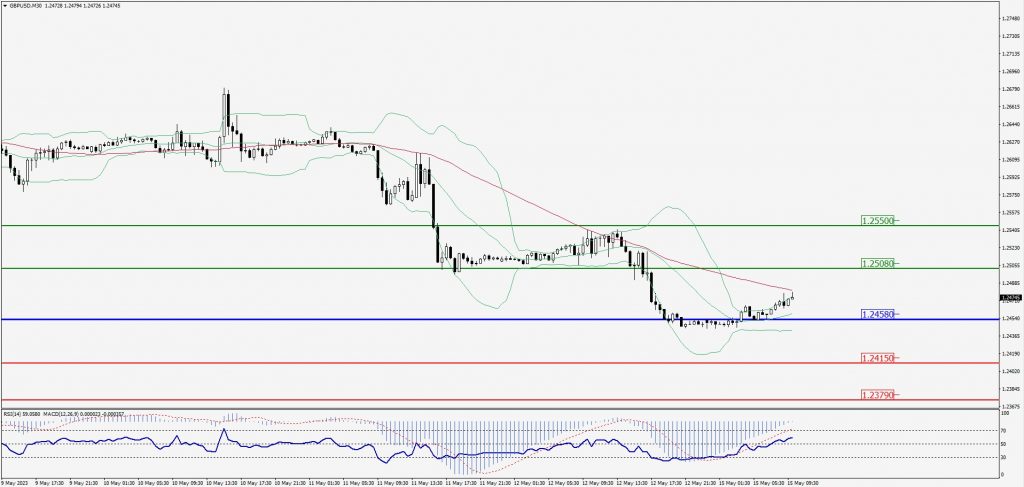
Green Lines Indicate Resistance Levels – Red Lines Indicate Support Levels
Light Blue is a Pivot Point – Black represents the price when the report was produced
USD/JPY Intraday: In a consolidation zone
Our pivot point is at 135.760
Preferable Price Action: Buy position above pivot with the target at 136.210 and 136.550 in extension.
Alternative Price Action: The downside breakout of the pivot would call for 135.340 and 135.030.
Comment: MACD is at 50 level and Pairs above 55MA.
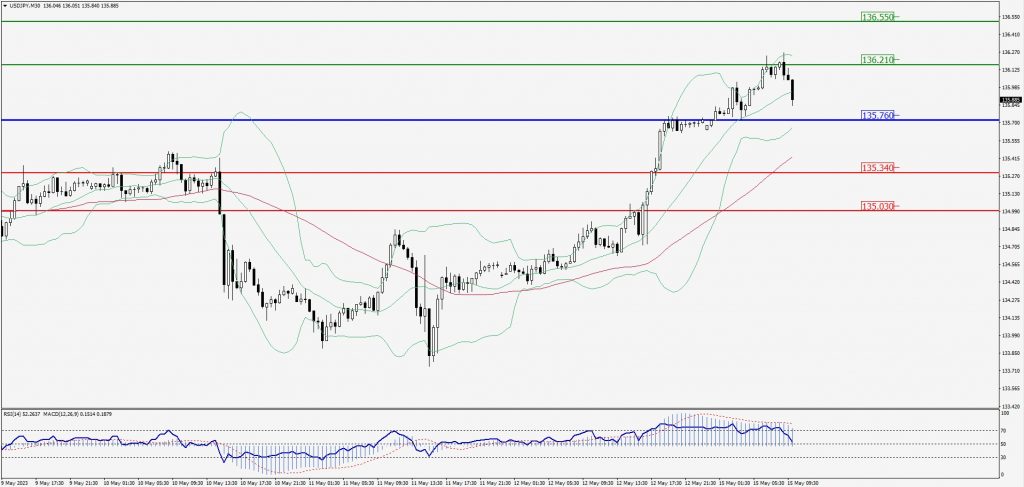
Green Lines Indicate Resistance Levels – Red Lines Indicate Support Levels
Light Blue is a Pivot Point – Black represents the price when the report was produced
AUD/USD Intraday: Trend on the upside
Our pivot point is at 0.66760
Preferable Price Action: Buy positions above pivot with targets at 0.67150 & 0.67430 in extension.
Alternative Price Action: Below pivot looks for a further downside with 0.66440 & 0.66160 as targets.
Comment: RSI is above 50 levels and Pairs above its 20MA & 55MA.
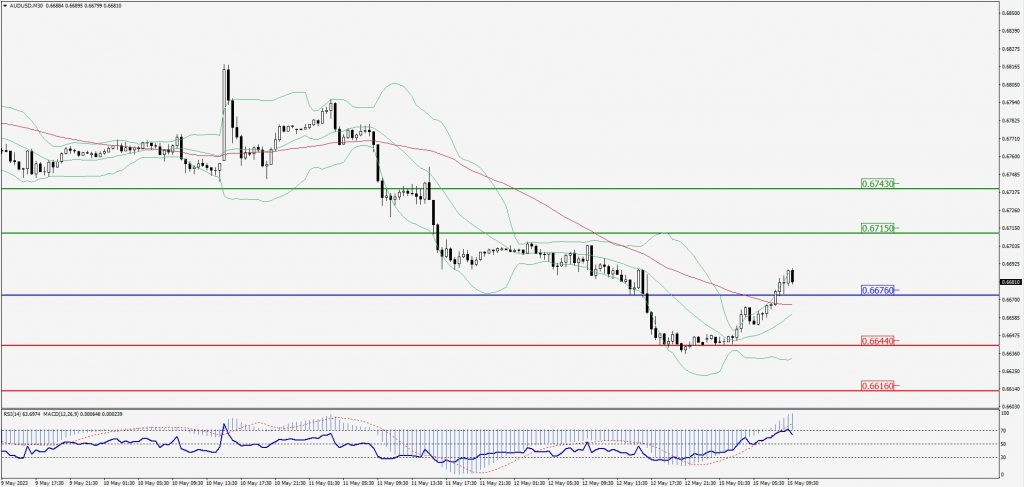
Green Lines Indicate Resistance Levels – Red Lines Indicate Support Levels
Light Blue is a Pivot Point – Black represents the price when the report was produced
CRUDEOIL Intraday: In a consolidation zone
Our pivot point is at 70.26
Preferable Price Action: Below pivot sell oil with 69.07 & 68.35 as targets.
Alternative Price Action: Buy crude above pivot with targets at 71.27 and 72.07 in extension.
Comment: MACD is negative territory and Pairs below 55MA.
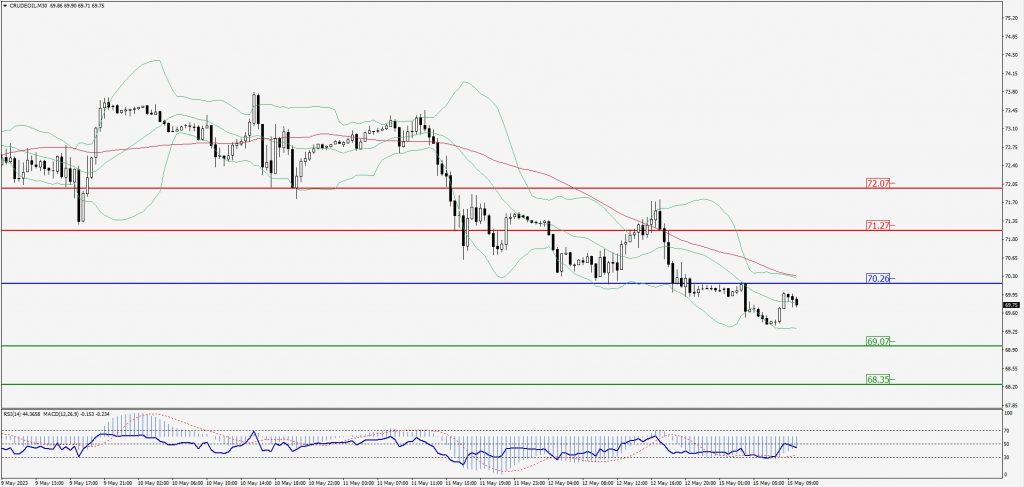
Green Lines Indicate Resistance Levels – Red Lines Indicate Support Levels
Light Blue is a Pivot Point – Black represents the price when the report was produced
XAU/USD Intraday: Trend on the upside
Our pivot point is 2014.50
Preferable Price Action: Further upside to 2027.30 and 2035.50
Alternative Price Action: If the price gives a downside breakout of a pivot, then the price extends to 2004.00 and 1997.00.
Comment: MACD is above 50 level and Pairs above its 20MA & 55MA.
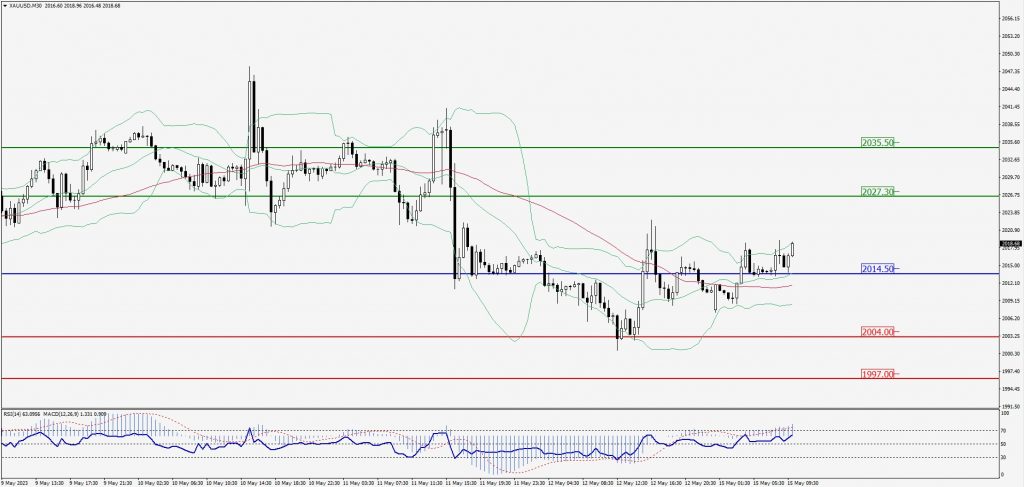
Green Lines Indicate Resistance Levels – Red Lines Indicate Support Levels
Light Blue is a Pivot Point – Black represents the price when the report was produced
Dow Jones Intraday: Trend on the upside
Our pivot point is 33,338.00
Preferable Price Action: Take buy positions above the pivot with targets at 33,476.00 & 33,571.00.
Alternative Price Action: Below 33,338.00 looks for further downside to 33,225.00 & 33,141.00.
Comment: RSI is above 50 levels and Pairs above its 20MA & 55MA.
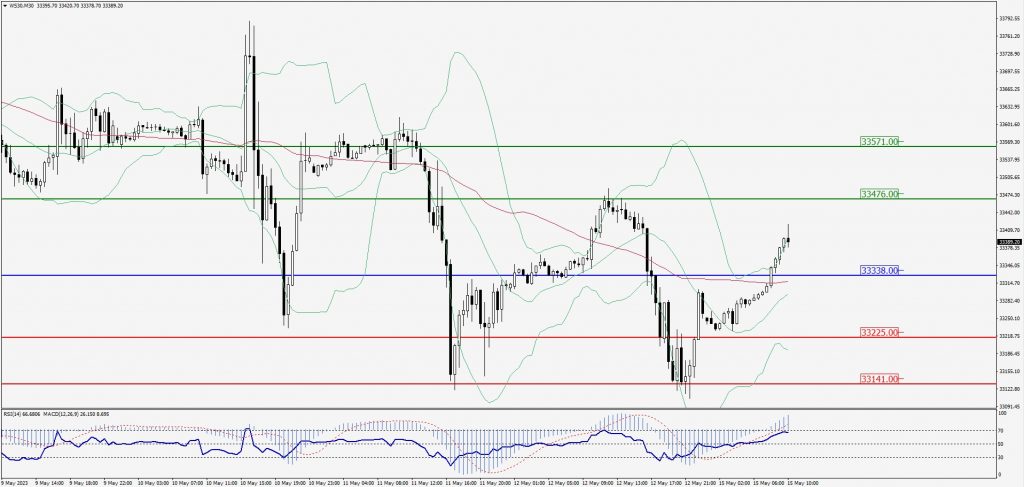
Green Lines Indicate Resistance Levels – Red Lines Indicate Support Levels
Light Blue is a Pivot Point – Black represents the price when the report was produced