Market Wrap: Stocks, Bonds, Commodities
US stocks pared losses late on Wednesday but the Dow and S&P 500 still closed lower, as problems at Credit Suisse revived fears of a banking crisis, eclipsing bets on a smaller US rate hike this month.
The Dow Jones Industrial Average fell 280.83 points to 31,874.57, the S&P 500 lose 27.36% to 3,891.93 and the Nasdaq Composite add 5.90 points to 11,434.05
MSCI’s index of Asia-Pacific stocks outside Japan is decline 0.94% to 611.79 levels. The Australian index was lower by 1.46% to 6,965.50. Japanese Nikkei Index decline 0.80% today.
European stocks were positive on Thrusday, with the Stoxx Europe 50 Index rose 0.61% to 4,057.45, Germany’s DAX advance 0.52% to 14,814.25, and France’s CAC ascend 0.57% to 6,924.37, and U.K.’s FTSE 100 add 0.47% to 7,375.30.
Benchmark 10-year U.S. Treasury fell as demand for safe assets ascend again, today 10-year bond yields are positive 0.49% to 3.5110.
Oil prices plunged by nearly 5 percent on Wednesday to settle at the lowest levels in more than a year on concerns that a crisis of confidence in the banking sector could trigger a recession and cut demand.
Spot Brent crude oil ascend 0.54% to $74.09 per barrel. US West Texas Intermediate crude is up 0.43% to $67.88 a barrel.
The yellow metal gold is decline 0.37% to 1,924.10 dollars per ounce.
Market Wrap: Forex
The dollar rose on Wednesday on safe-haven buying after Credit Suisse’s stock tumbled following the disclosure of “weaknesses” in its financial reporting that renewed investor concerns that a full-blown global banking crisis may be brewing.
Today, the U.S. dollar index measures the Greenback against a trade-weighted basket of six major currencies, which slipped 0.16% to 104.108.
The Euro US Dollar (EUR/USD) is a widely traded pair that is up 0.33% today. This left the pair trading around $1.06100.
The Japanese yen was negative against the U.S. dollar on Thrusday. Today USD/JPY is slipped 0.45% to the 132.810 level.
Another commodity-related currency mixed against the U.S dollar, AUD/USD rose 0.50% to 0.66470, and NZD/USD slipped 0.27% to 0.61680 level.
EUR/USD Intraday: Major trend on the upside
Our pivot point is at 1.06150
Preferable Price Action: Take buy positions above pivot level with targets at 1.06560 & 1.06870 in extension.
Alternative Price Action: Below pivot looks for a further downside to 1.05800 & 1.05560.
Comment: RSI is above 50 levels and Pairs above its 20MA & 55MA.
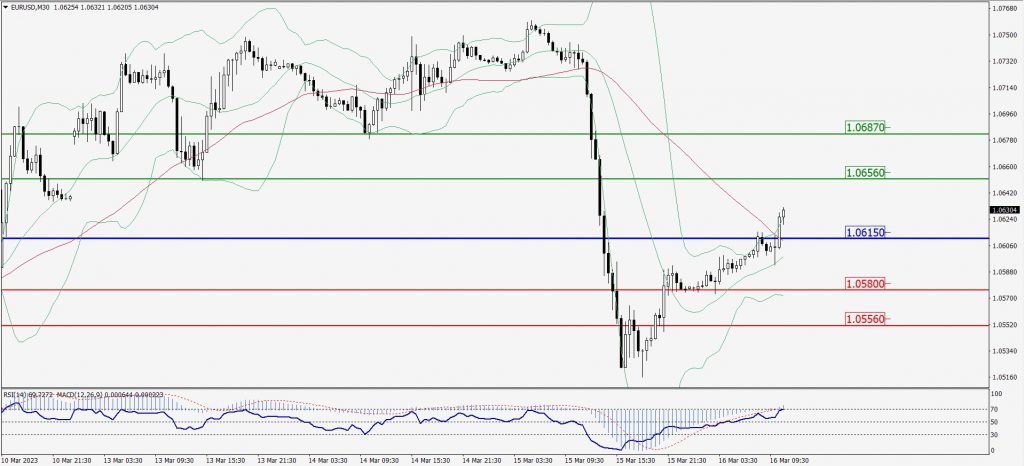
Green Lines Indicate Resistance Levels – Red Lines Indicate Support Levels
Light Blue is a Pivot Point – Black represents the price when the report was produced
GBP/USD Intraday: Trend on the upside
Our pivot point is at 1.20880
Preferable Price Action: Buy positions above pivot with targets at 1.21280 & 1.21570 in extension.
Alternative Price Action: The price below pivot would call for further downside to 1.20520 & 1.20270.
Comment: RSI is below 50 levels and Pairs below its 20MA & 55MA.
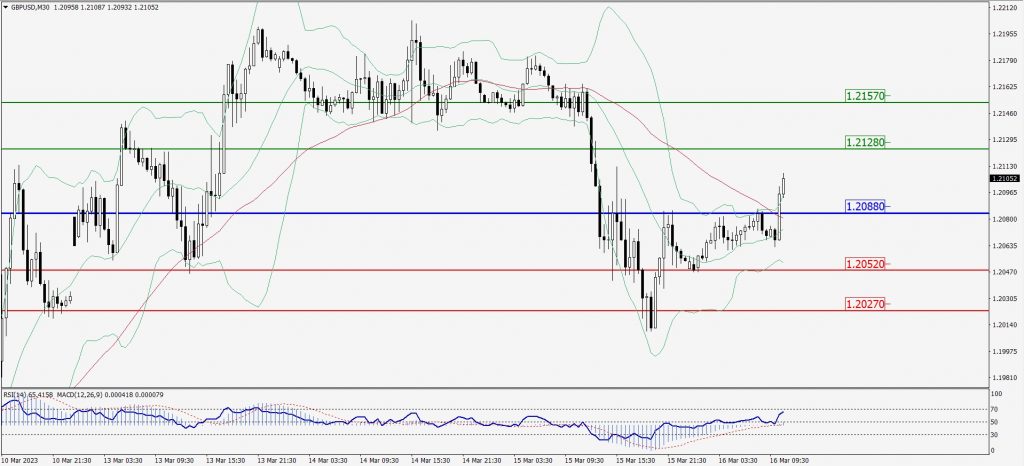
Green Lines Indicate Resistance Levels – Red Lines Indicate Support Levels
Light Blue is a Pivot Point – Black represents the price when the report was produced
USD/JPY Intraday: Support level at 132.910
Our pivot point is at 132.910
Preferable Price Action: Buy position above pivot with the target at 133.830 and 134.470 in extension.
Alternative Price Action: The downside breakout of the pivot would call for 132.150 and 131.610.
Comment: MACD is above 50 level and Pairs above 20MA.
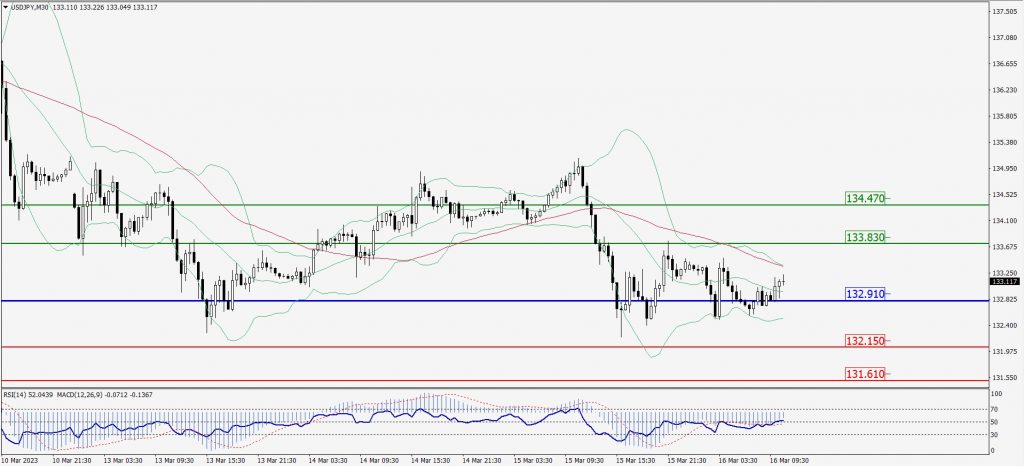
Green Lines Indicate Resistance Levels – Red Lines Indicate Support Levels
Light Blue is a Pivot Point – Black represents the price when the report was produced
AUD/USD Intraday: Major trend on the upside
Our pivot point is at 0.66480
Preferable Price Action: Buy positions above pivot with targets at 0.66760 & 0.66950 in extension.
Alternative Price Action: Below pivot looks for a further downside with 0.66240 & 0.66060 as targets.
Comment: RSI is above 50 levels and pairs above its 20MA & 55MA.
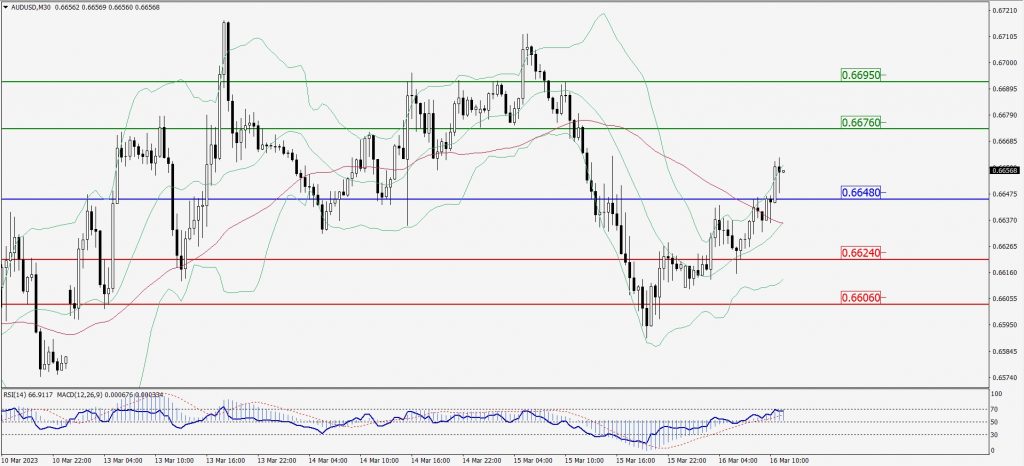
Green Lines Indicate Resistance Levels – Red Lines Indicate Support Levels
Light Blue is a Pivot Point – Black represents the price when the report was produced
CRUDEOIL Intraday: Trend on the downside
Our pivot point is at 69.02
Preferable Price Action: Below pivot sell oil with 67.31 & 65.93 as targets.
Alternative Price Action: Buy crude above pivot with targets at 70.52 and 71.84 in extension.
Comment: MACD is negative territory and Pairs below its 20MA & 55MA.
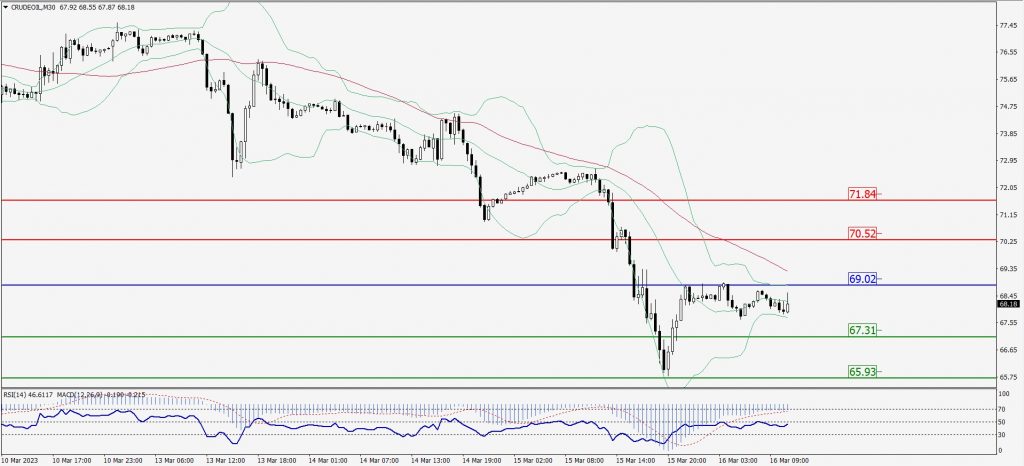
Green Lines Indicate Resistance Levels – Red Lines Indicate Support Levels
Light Blue is a Pivot Point – Black represents the price when the report was produced
XAU/USD Intraday: Trend on the upside
Our pivot point is 1916.20
Preferable Price Action: Further upside to 1937.70 and 1955.10
Alternative Price Action: If the price gives a downside breakout of a pivot, then the price extends to 1897.10 and 1882.30.
Comment: MACD is above 50 level and Pairs above its 20MA & 55MA.
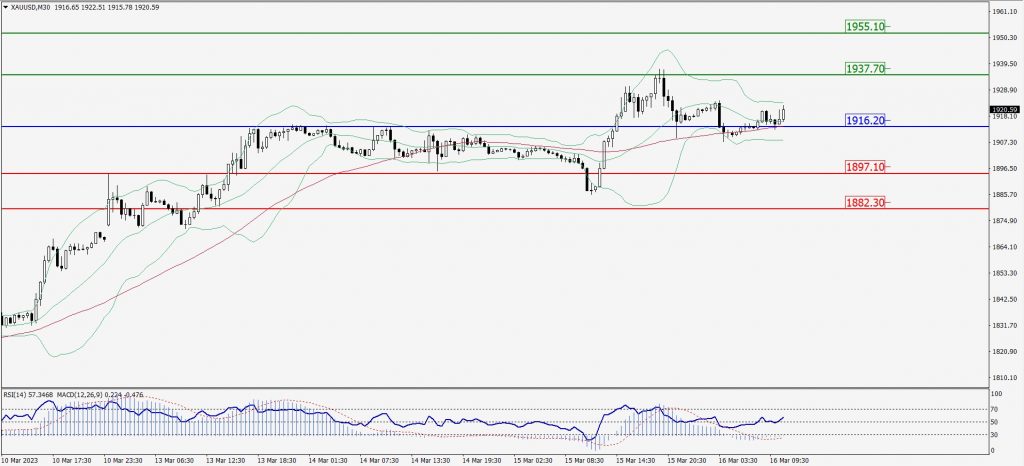
Green Lines Indicate Resistance Levels – Red Lines Indicate Support Levels
Light Blue is a Pivot Point – Black represents the price when the report was produced
Dow Jones Intraday: In a consolidation zone
Our pivot point is 31,974.00
Preferable Price Action: Take sell positions below the pivot with targets at 31,810.00 & 31,703.00.
Alternative Price Action: Above 31,974.00 looks for further upside to 32,130.00 & 32,253.00.
Comment: RSI is at 50 levels.
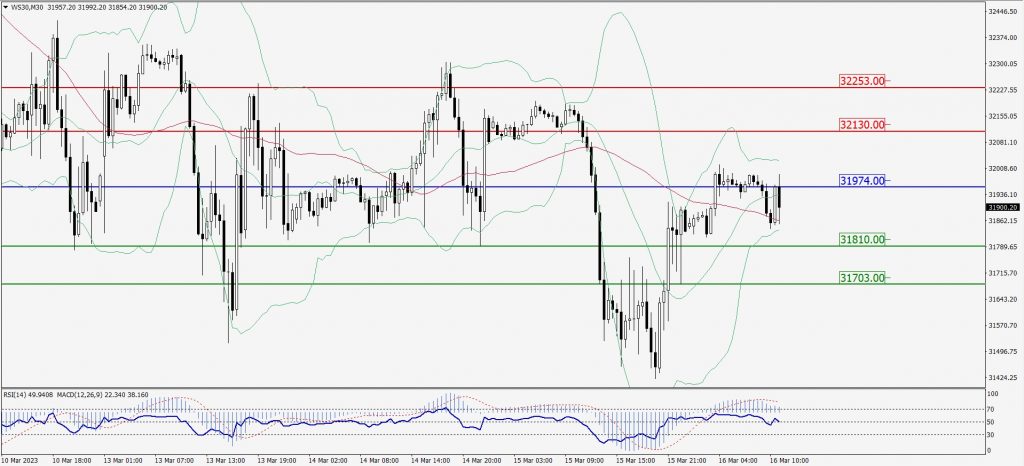
Green Lines Indicate Resistance Levels – Red Lines Indicate Support Levels
Light Blue is a Pivot Point – Black represents the price when the report was produced