Market Wrap: Stocks, Bonds, Commodities
US stocks bounced back on Tuesday as largely on-target inflation data and easing jitters over contagion in the banking sector cooled expectations regarding the size of the rate hike at the Federal Reserve’s policy meeting next week.
The Dow Jones Industrial Average rose 336.26 points to 32,155.40, the S&P 500 gain 1.65% to 3,919.29 and the Nasdaq Composite add 239.31 points to 11,428.15
MSCI’s index of Asia-Pacific stocks outside Japan is ascend 0.87% to 618.31 levels. The Australian index was higher by 0.86% to 7,068.90. Japanese Nikkei Index advance 0.03% today.
European stocks were negative on Wednesday, with the Stoxx Europe 50 Index fell 0.87% to 4,143.05, Germany’s DAX decline 0.55% to 15,146.05, and France’s CAC drop 1.07% to 7,065.51, and U.K.’s FTSE 100 subtract 0.85% to 7,572.30.
Benchmark 10-year U.S. Treasury fell as demand for safe assets ascend again, today 10-year bond yields are positive 0.89% to 3.6680.
Oil prices dropped over 4 percent to a three-month low on Tuesday after a US inflation report and the recent US bank failures sparked fears of a fresh financial crisis that could reduce future oil demand.
Spot Brent crude oil ascend 0.57% to $77.91 per barrel. US West Texas Intermediate crude is up 0.52% to $71.72 a barrel.
The yellow metal gold is decline 1.00% to 1,891.85 dollars per ounce.
Market Wrap: Forex
The dollar stabilized and the euro weakened in early trading on Tuesday in Europe, as the shock from the collapse of three U.S. banks in a week began to recede.
Today, the U.S. dollar index measures the Greenback against a trade-weighted basket of six major currencies, which slipped 0.17% to 103.392.
The Euro US Dollar (EUR/USD) is a widely traded pair that is down 0.13% today. This left the pair trading around $1.07180.
The Japanese yen was negative against the U.S. dollar on Wednesday. Today USD/JPY is surged 0.26% to the 134.560 level.
Another commodity-related currency negative against the U.S dollar, AUD/USD fell 0.17% to 0.66670, and NZD/USD slipped 0.35% to 0.62140 level.
EUR/USD Intraday: Resistance level at 1.07510
Our pivot point is at 1.07510
Preferable Price Action: Take short positions below pivot level with targets at 1.07100 & 1.06840 in extension.
Alternative Price Action: Above pivot looks for a further upside to 1.07870 & 1.08130.
Comment: RSI is below 50 levels and Pairs below 20MA.
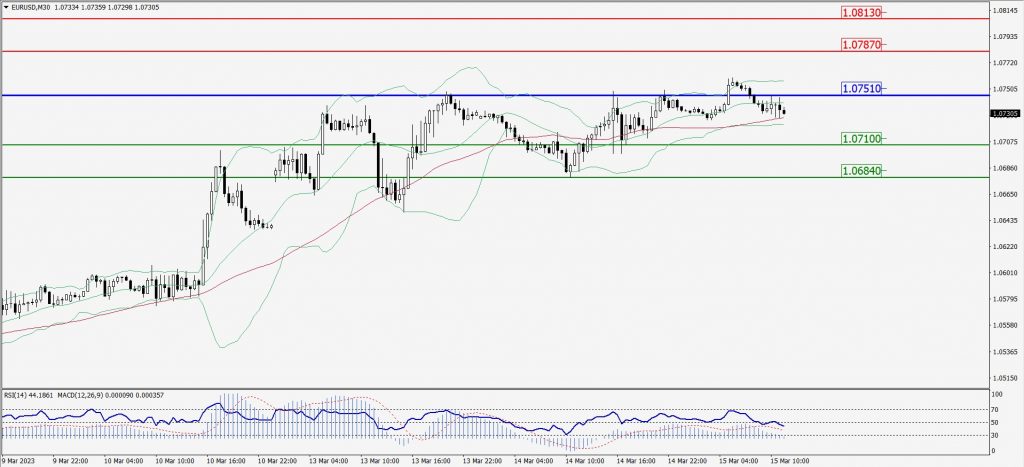
Green Lines Indicate Resistance Levels – Red Lines Indicate Support Levels
Light Blue is a Pivot Point – Black represents the price when the report was produced
GBP/USD Intraday: Trend on the downside
Our pivot point is at 1.21850
Preferable Price Action: Sell positions below pivot with targets at 1.21330 & 1.20960 in extension.
Alternative Price Action: The price above pivot would call for further upside to 1.22260 & 1.22660.
Comment: RSI is below 50 levels and Pairs below its 20MA & 55MA.
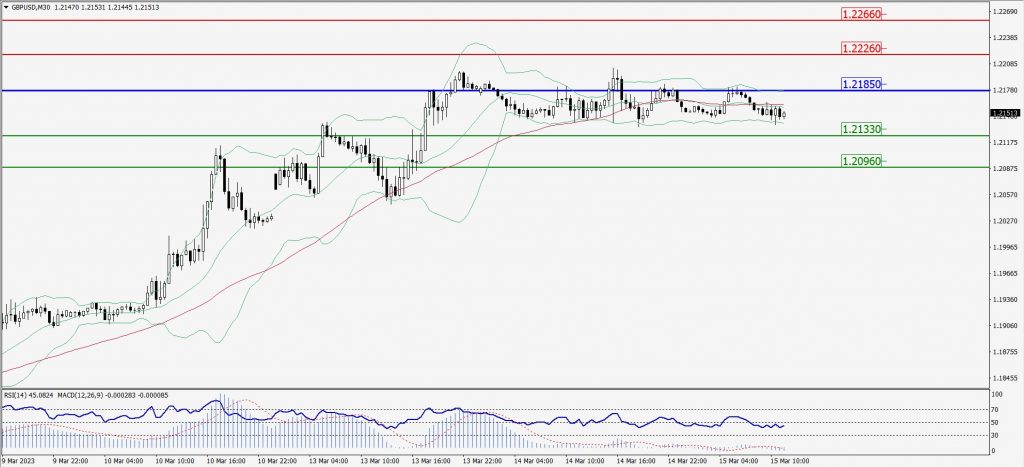
Green Lines Indicate Resistance Levels – Red Lines Indicate Support Levels
Light Blue is a Pivot Point – Black represents the price when the report was produced
USD/JPY Intraday: Trend on the upside
Our pivot point is at 134.650
Preferable Price Action: Buy position above pivot with the target at 135.480 and 136.050 in extension.
Alternative Price Action: The downside breakout of the pivot would call for 133.960 and 133.430.
Comment: MACD is above 50 level and Pairs above its 20MA & 55MA.
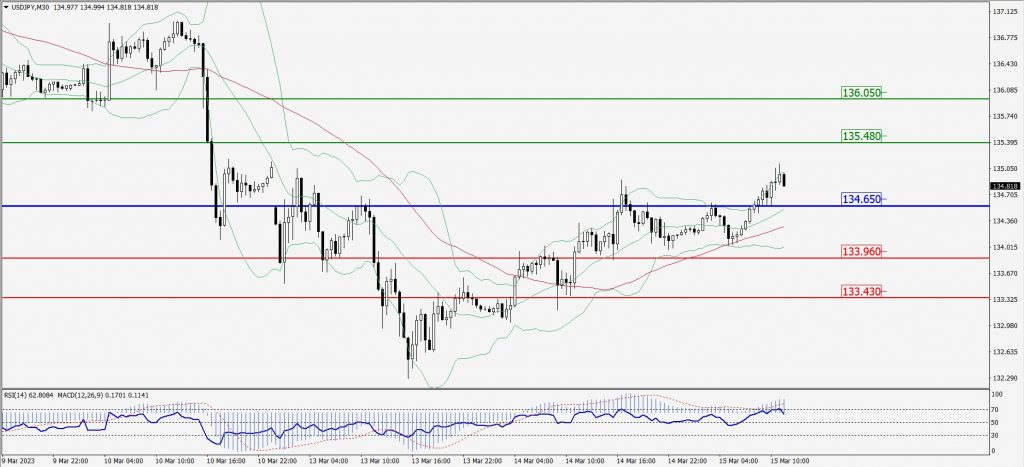
Green Lines Indicate Resistance Levels – Red Lines Indicate Support Levels
Light Blue is a Pivot Point – Black represents the price when the report was produced
AUD/USD Intraday: Major resistance level at 0.66900
Our pivot point is at 0.66900
Preferable Price Action: Sell positions below pivot with targets at 0.66580 & 0.66340 in extension.
Alternative Price Action: Above pivot looks for a further upside with 0.67200 & 0.67420 as targets.
Comment: RSI is below 50 levels and pairs below 20MA.
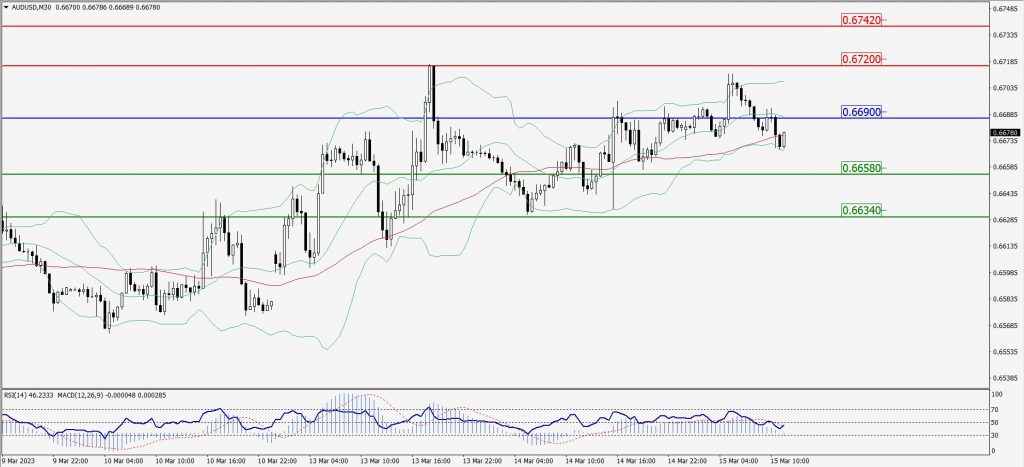
Green Lines Indicate Resistance Levels – Red Lines Indicate Support Levels
Light Blue is a Pivot Point – Black represents the price when the report was produced
CRUDEOIL Intraday: Trend on the upside
Our pivot point is at 72.37
Preferable Price Action: Above pivot buy oil with 73.71 & 74.86 as targets.
Alternative Price Action: Sell crude below pivot with targets at 71.08 and 70.10 in extension.
Comment: MACD is positive territory and Pairs above 20MA.
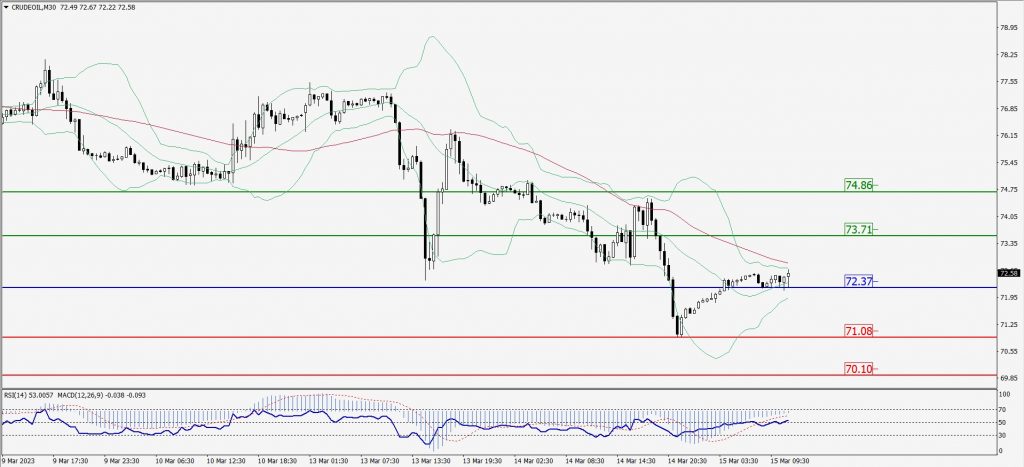
Green Lines Indicate Resistance Levels – Red Lines Indicate Support Levels
Light Blue is a Pivot Point – Black represents the price when the report was produced
XAU/USD Intraday: Major trend on the downside
Our pivot point is 1899.00
Preferable Price Action: Further downside to 1873.90 and 1857.60
Alternative Price Action: If the price gives an upside breakout of a pivot, then the price extends to 1924.10 and 1942.00.
Comment: MACD is below 50 level and Pairs below its 20MA & 55MA.
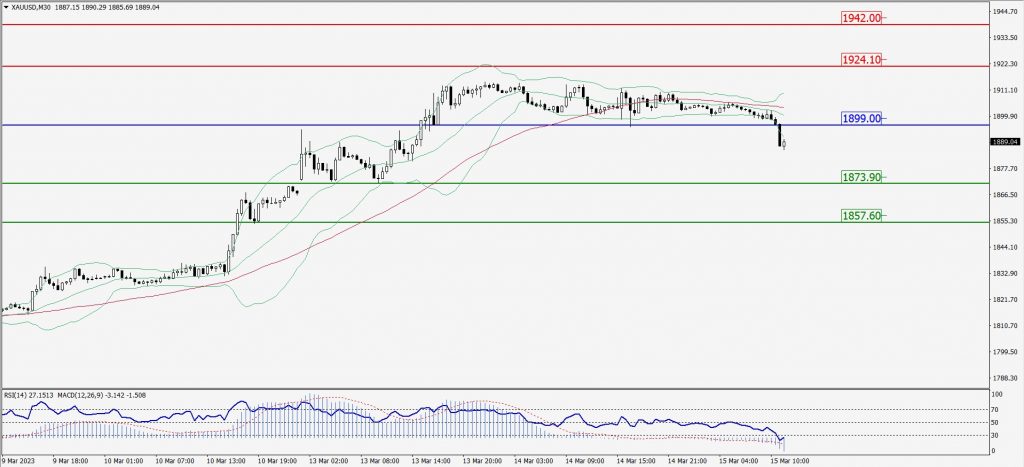
Green Lines Indicate Resistance Levels – Red Lines Indicate Support Levels
Light Blue is a Pivot Point – Black represents the price when the report was produced
Dow Jones Intraday: In a consolidation zone
Our pivot point is 32,205.00
Preferable Price Action: Take sell positions below the pivot with targets at 32,004.00 & 31,860.00.
Alternative Price Action: Above 32,205.00 looks for further upside to 32,421.00 & 32,578.00.
Comment: RSI is at 50 levels and Pairs below 20MA.
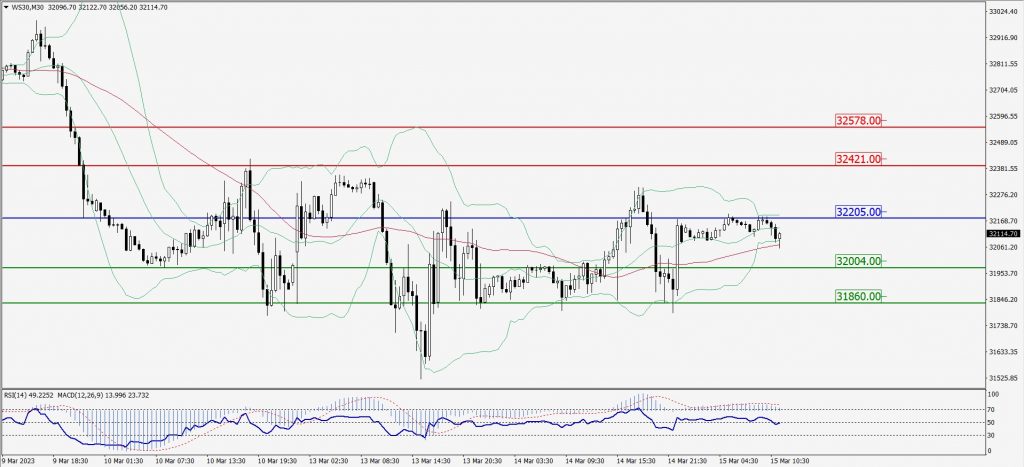
Green Lines Indicate Resistance Levels – Red Lines Indicate Support Levels
Light Blue is a Pivot Point – Black represents the price when the report was produced