Market Wrap: Stocks, Bonds, Commodities
US stocks tumbled Friday following a mixed start to earnings reporting season. Worries about potentially escalating tensions in the Middle East rattled financial markets, pushing investors to look for safer places for their money.
The Dow Jones Industrial Average fell 475.84 points to 37,983.24, the S&P 500 loss 1.46% to 5,123.41 and the Nasdaq Composite descend 267.10 points to 16,175.09.
MSCI’s index of Asia-Pacific stocks outside Japan is decline 0.95% to 647.34 levels. The Australian index was lower by 0.46% to 7,752.50. Japanese Nikkei Index drop 0.90% today.
European stocks were mixed on Monday, with the Stoxx Europe 50 Index increase 0.76% to 4,992.75, Germany’s DAX surged 0.89% to 18,062.75, and France’s CAC higher 0.56% to 8,055.40 and U.K.’s FTSE 100 loss 0.51% to 7,954.61.
Benchmark 10-year U.S. Treasury rose as demand for safe assets surged again, today 10-year bond yields positive 1.25% to 4.552.
Oil prices fell at Asia’s open on Monday, as market participants dialled back risk premiums following Iran’s attack on Israel late on Saturday which the Israeli government said caused limited damage.
Spot Brent crude oil descend 1.21% to $89.36 per barrel. US West Texas Intermediate crude is down 1.32% to $84.52 a barrel.
The yellow metal gold is decline 0.33% to 2,366.05 dollars per ounce.
Market Wrap: Forex
The dollar was steady on Monday, holding its biggest weekly gain since 2022, as the prospect of stubbornly high U.S. interest rates and escalating conflict in the Middle East gave support.
Today, the U.S. dollar index measures the Greenback against a trade-weighted basket of six major currencies, which drop 0.13% to 105.690.
The Euro US Dollar (EUR/USD) is a widely traded pair that is up 0.15% today. This left the pair trading around $1.06570.
The Japanese yen was positive against the U.S. dollar on Monday. Today USD/JPY is surged 0.36% to the 153.830 level.
Another commodity-related currency positive against the U.S dollar, AUD/USD rose 0.31% to 0.64830, and NZD/USD surged 0.14% to 0.59440 level.
EUR/USD Intraday: Trend on the upside
Our pivot point is at 1.06450
Preferable Price Action: Take buy positions above pivot level with targets at 1.06980 & 1.07330 in extension.
Alternative Price Action: Below pivot looks for a further downside to 1.05990 & 1.05660.
Comment: RSI is above 50 levels.
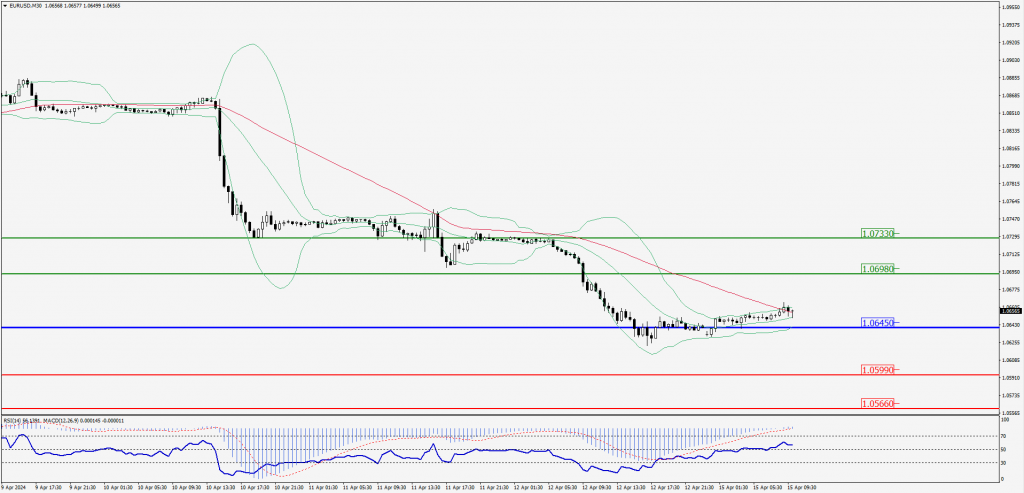
Green Lines Indicate Resistance Levels – Red Lines Indicate Support Levels
Light Blue is a Pivot Point – Black represents the price when the report was produced
GBP/USD Intraday: Trend on the upside
Our pivot point is at 1.24700
Preferable Price Action: Buy positions above pivot with targets at 1.25180 & 1.25580 in extension.
Alternative Price Action: The price below pivot would call for further downside to 1.24210 & 1.23910.
Comment: RSI is above 50 levels and Pairs above 20MA.
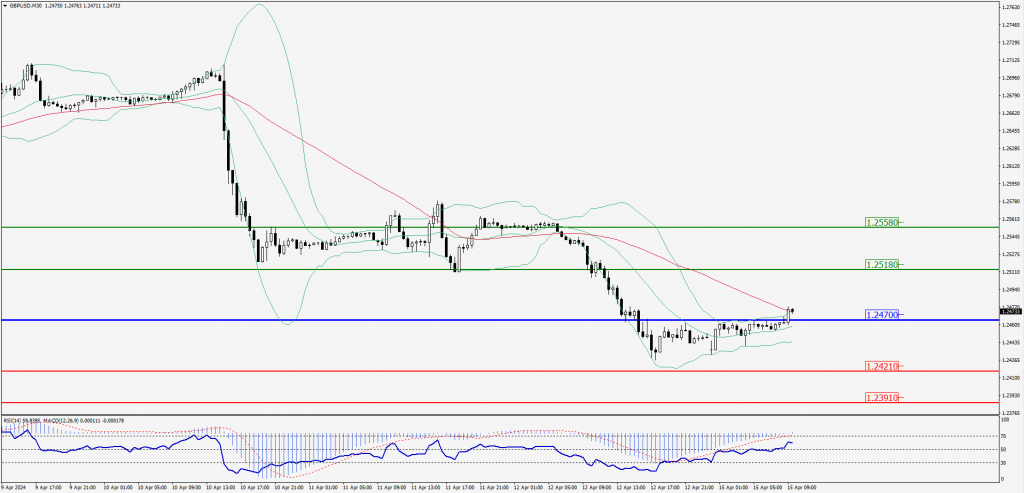
Green Lines Indicate Resistance Levels – Red Lines Indicate Support Levels
Light Blue is a Pivot Point – Black represents the price when the report was produced
USD/JPY Intraday: Major trend on the upside
Our pivot point is at 153.740
Preferable Price Action: Buy position above pivot with the target at 154.220 and 154.550 in extension.
Alternative Price Action: The downside breakout of the pivot would call for 153.280 and 152.930.
Comment: MACD is above 50 levels and Pairs above its 20MA & 55MA.
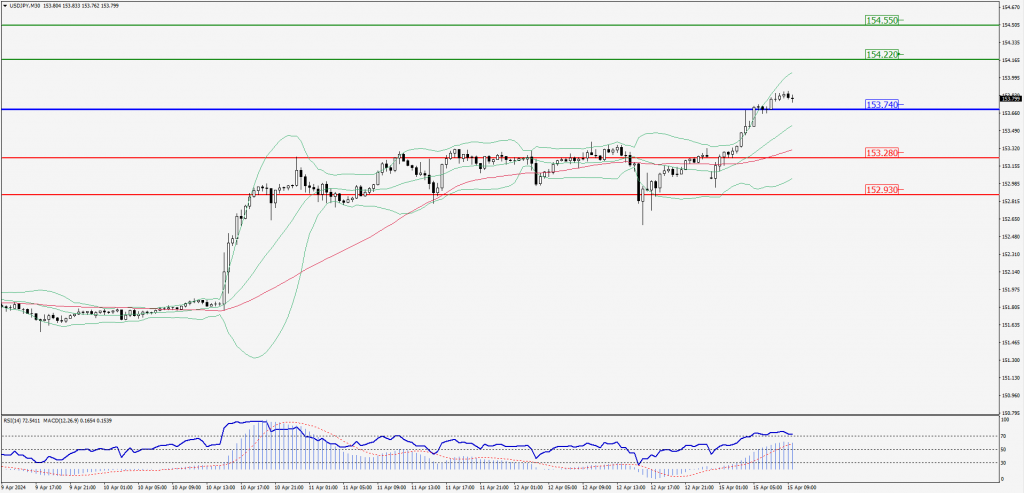
Green Lines Indicate Resistance Levels – Red Lines Indicate Support Levels
Light Blue is a Pivot Point – Black represents the price when the report was produced
AUD/USD Intraday: Trend on the upside
Our pivot point is at 0.64830
Preferable Price Action: Buy positions above pivot with targets at 0.65160 & 0.65410 in extension.
Alternative Price Action: Below pivot looks for a further downside with 0.64500 & 0.64270 as targets.
Comment: RSI is above 50 levels and pairs above 20MA.
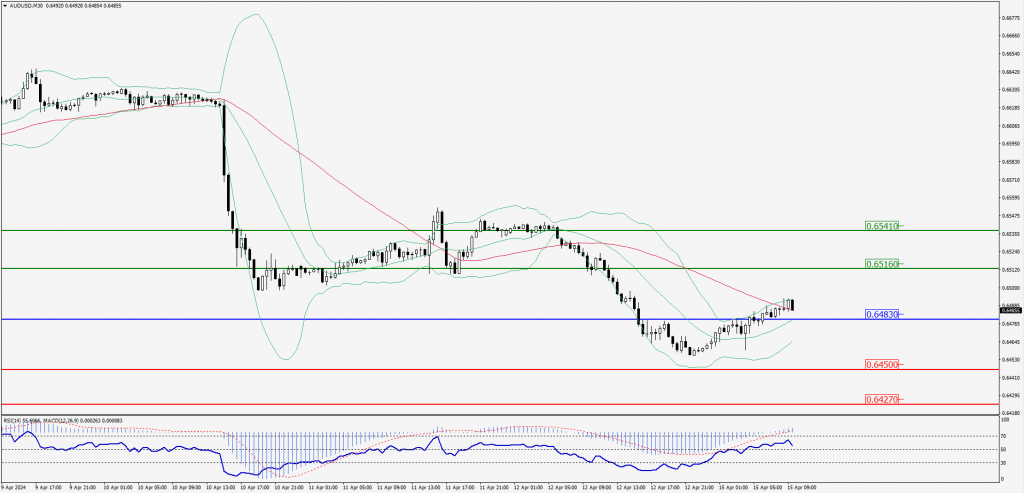
Green Lines Indicate Resistance Levels – Red Lines Indicate Support Levels
Light Blue is a Pivot Point – Black represents the price when the report was produced
CRUDEOIL Intraday: Trend on the downside
Our pivot point is at 84.76
Preferable Price Action: Below pivot sell oil with 84.14 & 83.63 as targets.
Alternative Price Action: Buy crude above pivot with targets at 85.38 and 85.89 in extension.
Comment: MACD is negative territory and pairs below its 20MA & 55MA.
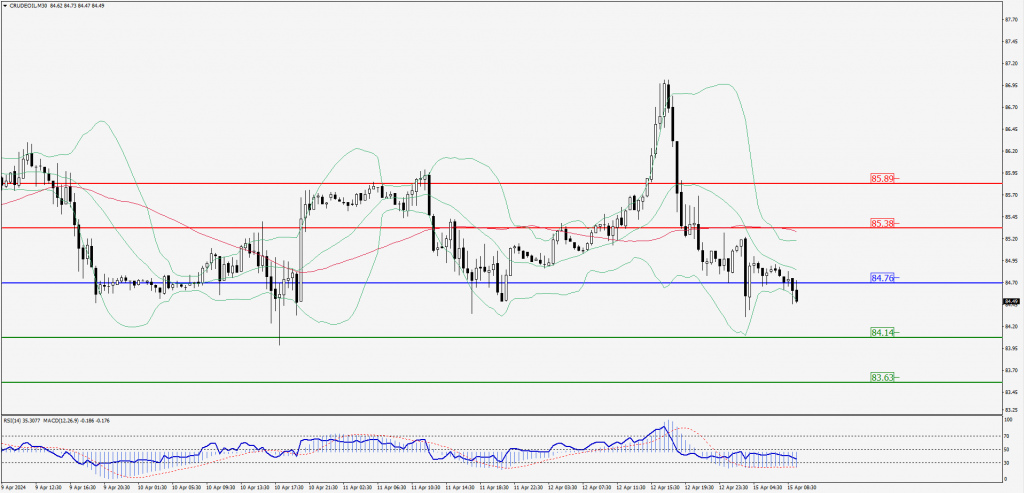
Green Lines Indicate Resistance Levels – Red Lines Indicate Support Levels
Light Blue is a Pivot Point – Black represents the price when the report was produced
XAU/USD Intraday: Resistance level at 2360.40
Our pivot point is 2360.40
Preferable Price Action: Further downside to 2338.70 and 2321.10.
Alternative Price Action: If the price gives an upside breakout of a pivot, then the price extends to 2381.60 and 2399.20.
Comment: MACD is below 50 levels and pairs below its 20MA & 55MA.
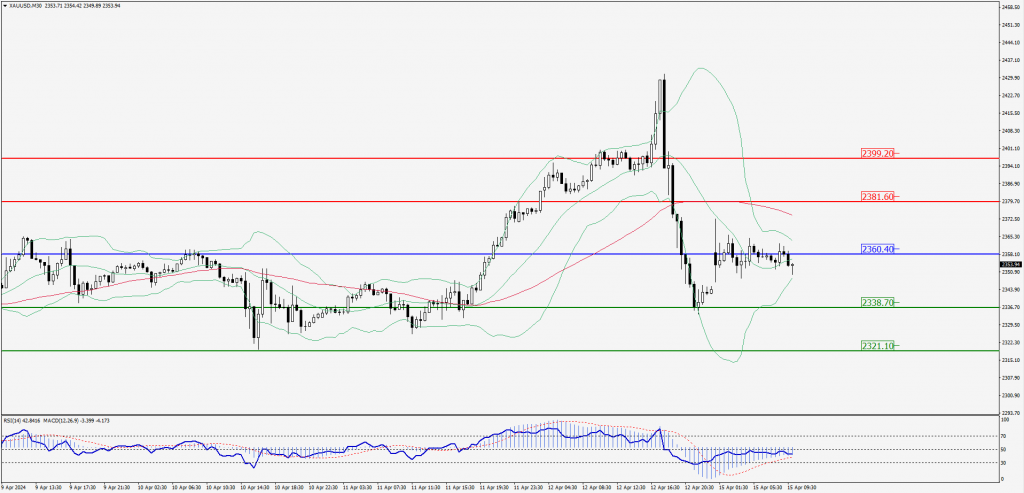
Green Lines Indicate Resistance Levels – Red Lines Indicate Support Levels
Light Blue is a Pivot Point – Black represents the price when the report was produced
Dow Jones Intraday: Trend on the upside
Our pivot point is 38,111.30
Preferable Price Action: Take buy positions above the pivot with targets at 38,270.70 & 38,420.90.
Alternative Price Action: Below 38,111.30 looks for further downside to 37,944.60 & 37,816.40.
Comment: RSI is above 50 levels and Pairs above 20MA.
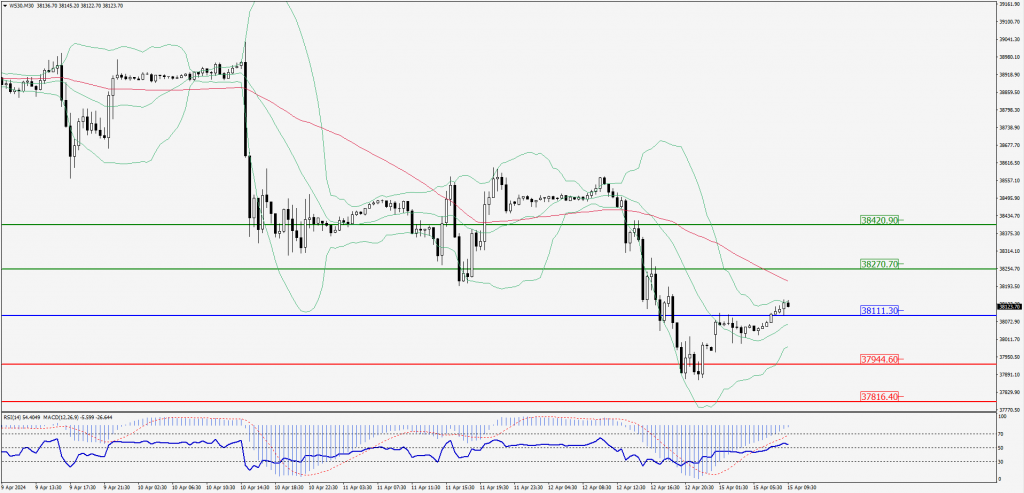
Green Lines Indicate Resistance Levels – Red Lines Indicate Support Levels
Light Blue is a Pivot Point – Black represents the price when the report was produced