Market Wrap: Stocks, Bonds, Commodities
US stocks closed higher on Thursday, with tech-related momentum stocks leading the charge, as fresh economic data rekindled hopes that inflation remains in a cooling trend.
The Dow Jones Industrial Average fell 2.43 points to 38,459.08, the S&P 500 gain 0.74% to 5,199.06 and the Nasdaq Composite ascend 271.84 points to 16,442.20.
MSCI’s index of Asia-Pacific stocks outside Japan is decline 1.18% to 654.80 levels. The Australian index was lower by 0.33% to 7788.10. Japanese Nikkei Index surged 0.31% today.
European stocks were positive on Friday, with the Stoxx Europe 50 Index increase 0.83% to 5,007.05, Germany’s DAX surged 0.93% to 18,110, and France’s CAC higher 0.86% to 8,091.87 and U.K.’s FTSE 100 gain 1.25% to 8,022.60.
Benchmark 10-year U.S. Treasury rose as demand for safe assets drop again, today 10-year bond yields negative 0.94% to 4.533.
Oil prices rose in early trade on Friday on heightened tensions in the Middle East, where Iran has promised to retaliate for a suspected Israeli air strike on its embassy in Syria, which could risk disruptions to supply from the oil producing region.
Spot Brent crude oil ascend 0.91% to $90.56 per barrel. US West Texas Intermediate crude is up 1.12% to $85.98 a barrel.
The yellow metal gold is advance 1.70% to 2413.15 dollars per ounce.
Market Wrap: Forex
The dollar rose moderately on Thursday in choppy trading, as weaker-than-expected March U.S. producer prices did not relieve concerns about persistent inflation which has reinforced the belief that the Federal Reserve will delay cutting interest rates this year.
Today, the U.S. dollar index measures the Greenback against a trade-weighted basket of six major currencies, which surged 0.55% to 105.640.
The Euro US Dollar (EUR/USD) is a widely traded pair that is down 0.62% today. This left the pair trading around $1.06570.
The Japanese yen was positive against the U.S. dollar on Friday. Today USD/JPY is surged 0.02% to the 153.310 level.
Another commodity-related currency negative against the U.S dollar, AUD/USD fell 0.40% to 0.65040, and NZD/USD drop 0.44% to 0.59690 level.
EUR/USD Intraday: Major trend on the downside
Our pivot point is at 1.07010
Preferable Price Action: Take sell positions below pivot level with targets at 1.06560 & 1.06240 in extension.
Alternative Price Action: Above pivot looks for a further upside to 1.07460 & 1.07860.
Comment: RSI is below 50 levels and pairs below its 20MA and 55MA.
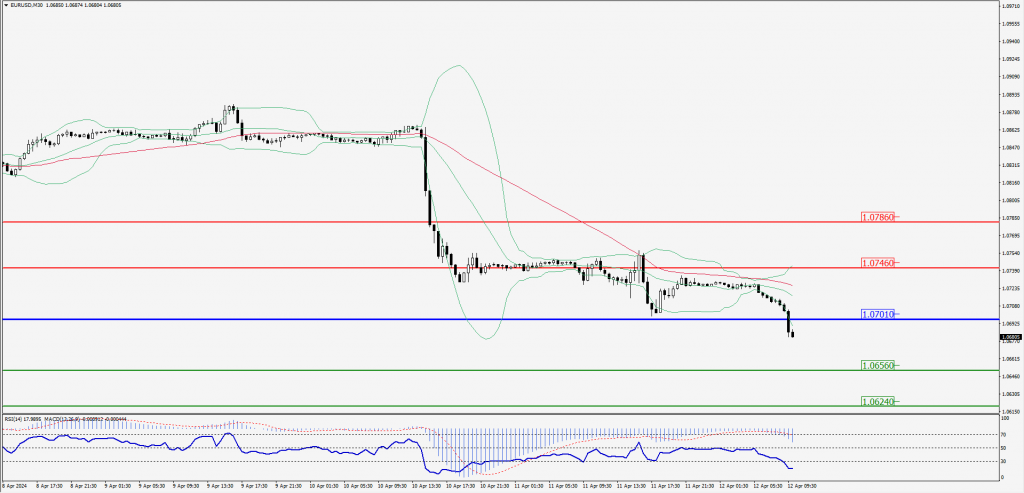
Green Lines Indicate Resistance Levels – Red Lines Indicate Support Levels
Light Blue is a Pivot Point – Black represents the price when the report was produced
GBP/USD Intraday: Major trend on the downside
Our pivot point is at 1.25280
Preferable Price Action: Sell positions below pivot with targets at 1.24760 & 1.24300 in extension.
Alternative Price Action: The price above pivot would call for further upside to 1.25790 & 1.26280.
Comment: RSI is below 50 levels and Pairs below 20MA and 55MA.
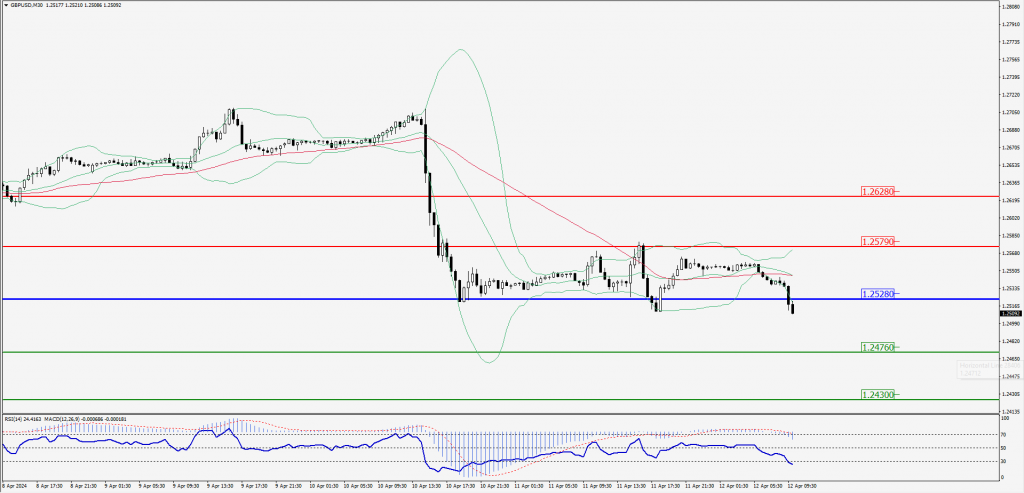
Green Lines Indicate Resistance Levels – Red Lines Indicate Support Levels
Light Blue is a Pivot Point – Black represents the price when the report was produced
USD/JPY Intraday: Trend on the upside
Our pivot point is at 153.250
Preferable Price Action: Buy position above pivot with the target at 153.660 and 154.010 in extension.
Alternative Price Action: The downside breakout of the pivot would call for 152.830 and 152.470.
Comment: MACD is above 50 levels and Pairs above its 20MA and 55MA.
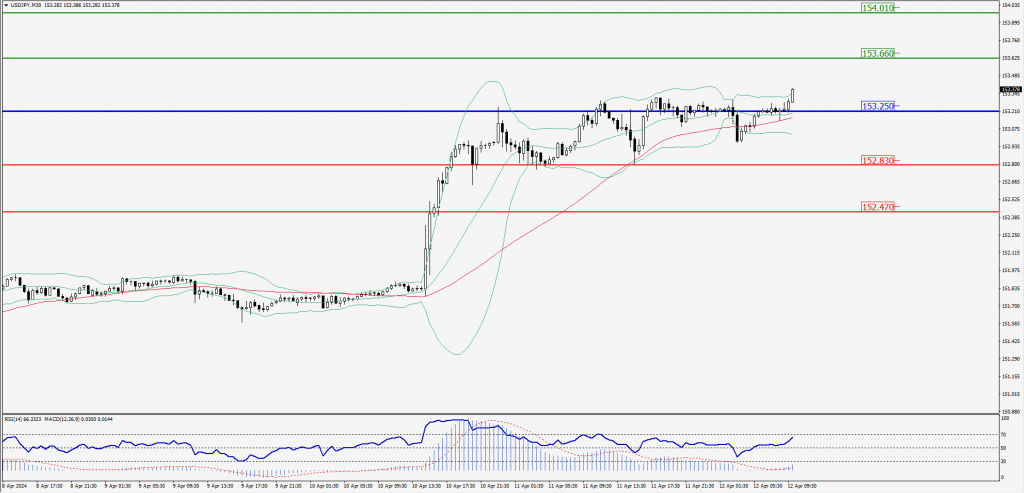
Green Lines Indicate Resistance Levels – Red Lines Indicate Support Levels
Light Blue is a Pivot Point – Black represents the price when the report was produced
AUD/USD Intraday: Trend on the downside
Our pivot point is at 0.65250
Preferable Price Action: Sell positions below pivot with targets at 0.64910 & 0.64640 in extension.
Alternative Price Action: Above pivot looks for a further upside with 0.65580 & 0.65880 as targets.
Comment: RSI is below 50 levels and pairs below 20MA and 55MA.
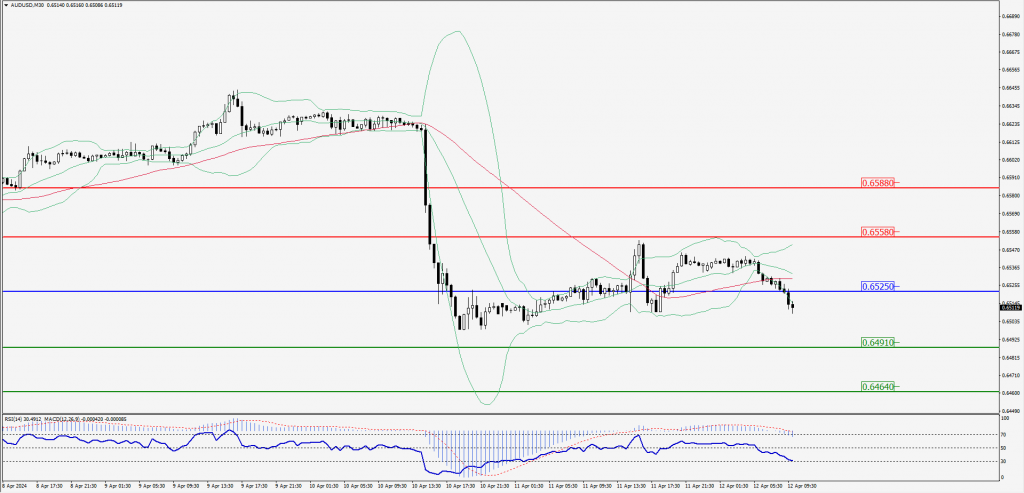
Green Lines Indicate Resistance Levels – Red Lines Indicate Support Levels
Light Blue is a Pivot Point – Black represents the price when the report was produced
CRUDEOIL Intraday: Trend on the upside
Our pivot point is at 85.11
Preferable Price Action: Above pivot buy oil with 85.71 & 86.19 as targets.
Alternative Price Action: Sell crude below pivot with targets at 84.51 and 83.99 in extension.
Comment: MACD is positive territory and pairs above 20MA and 55MA.
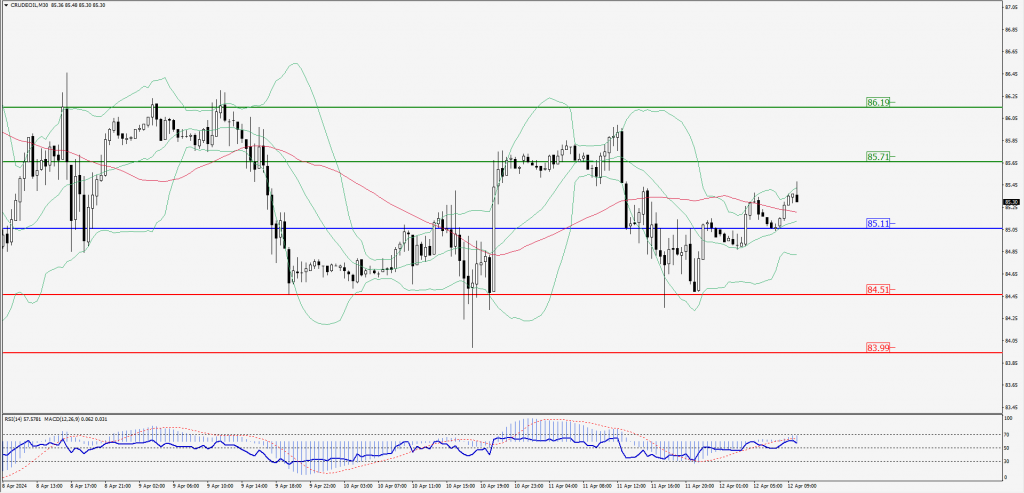
Green Lines Indicate Resistance Levels – Red Lines Indicate Support Levels
Light Blue is a Pivot Point – Black represents the price when the report was produced
XAU/USD Intraday: Major trend on the upside
Our pivot point is 2387.90
Preferable Price Action: Further upside to 2414.10 and 2431.70.
Alternative Price Action: If the price gives a downside breakout of a pivot, then the price extends to 2362.70 and 2345.10.
Comment: MACD is above 50 levels and pairs above 20MA and 55MA.
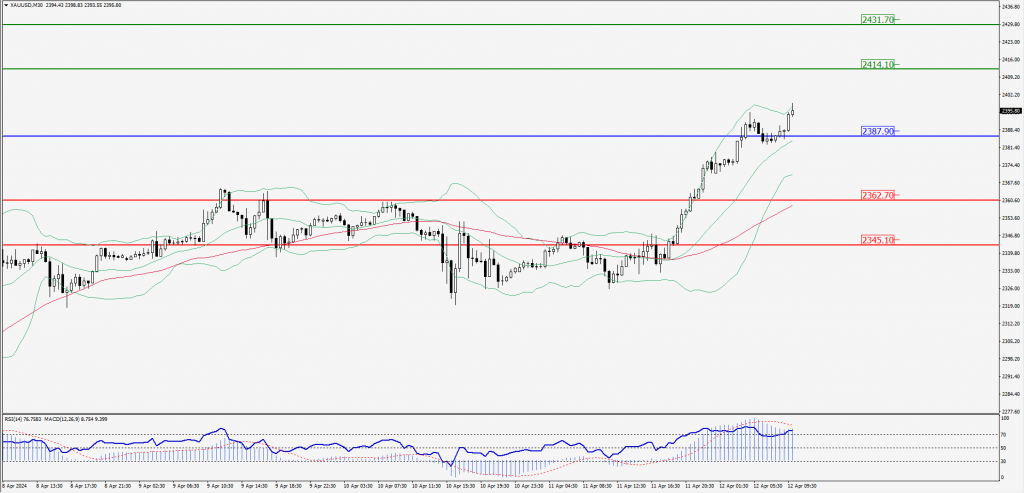
Green Lines Indicate Resistance Levels – Red Lines Indicate Support Levels
Light Blue is a Pivot Point – Black represents the price when the report was produced
Dow Jones Intraday: Trend on the upside
Our pivot point is 38,486.20
Preferable Price Action: Take buy positions above the pivot with targets at 38,631.50 & 38,741.70.
Alternative Price Action: Below 38,486.20 looks for further downside to 38,335.80 & 38,228.10.
Comment: RSI is above 50 levels and Pairs above its 20MA & 55MA.
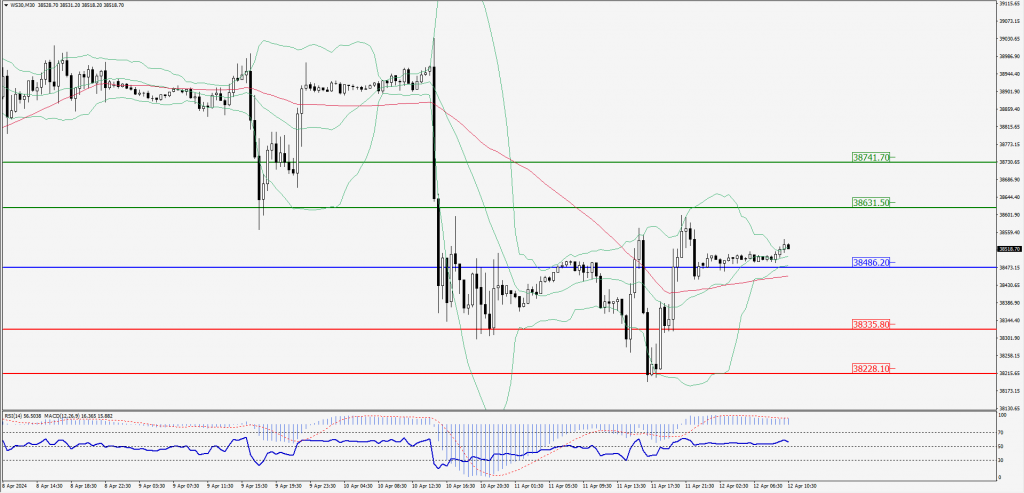
Green Lines Indicate Resistance Levels – Red Lines Indicate Support Levels
Light Blue is a Pivot Point – Black represents the price when the report was produced