Market Wrap: Stocks, Bonds, Commodities
U.S. stock futures were trading in a tight range during Tuesday’s evening deals, following a mixed session for major benchmarks, as investors braced for fresh consumer price index data set for release during Wednesday’s session.
The Dow Jones Industrial Average fell 17.73 points to 34,645.99, the S&P 500 lose 0.57% to 4,461.90 and the Nasdaq Composite subtract 144.28 points to 13,773.62.
MSCI’s index of Asia-Pacific stocks outside Japan is decline 0.12% to 618.57 levels. The Australian index was lower by 0.74% to 7,153.90. Japanese Nikkei Index drop 0.23% today.
European stocks were negative on Wednesday, with the Stoxx Europe 50 Index fell 0.66% to 4,215.35, Germany’s DAX drop 0.53% to 15,636.15, and France’s CAC decline 0.44% to 7,221.00 and U.K.’s FTSE 100 subtract 0.08% to 7,521.46.
Benchmark 10-year U.S. Treasury fell as demand for safe assets ascend again, today 10-year bond yields positive 0.90% to 4.3030.
Oil rose on Wednesday, firming its ground near a 10-month peak reached during trading a day earlier, as the market balanced supply concerns over Libya output and OPEC+ cuts with global macroeconomic headwinds.
Spot Brent crude oil ascend 0.60% to $92.61 per barrel. US West Texas Intermediate crude is up 0.64% to $89.41 a barrel.
The yellow metal gold is decline 0.03% to 1,934.75 dollars per ounce.
Market Wrap: Forex
The U.S. dollar fell in early European trade Wednesday, retreating from a six-month high, while the Japanese yen surged as comments from Bank of Japan Governor Kazuo Ueda signaled a potential change in monetary policy.
Today, the U.S. dollar index measures the Greenback against a trade-weighted basket of six major currencies, which surged 0.05% to 104.380.
The Euro US Dollar (EUR/USD) is a widely traded pair that is down 0.18% today. This left the pair trading around $1.07330.
The Japanese yen was negative against the U.S. dollar on Wednesday. Today USD/JPY is surged 0.17% to the 147.330 level.
Another commodity-related currency mixed against the U.S dollar, AUD/USD fell 0.18% to 0.64120, and NZD/USD surged 0.05% to 0.59050 level.
EUR/USD Intraday: Trend on the downside
Our pivot point is at 1.07440
Preferable Price Action: Take sell positions below pivot level with targets at 1.07240 & 1.07120 in extension.
Alternative Price Action: Above pivot looks for a further upside to 1.07630 & 1.07760.
Comment: RSI is below 50 levels and Pairs below 20MA.
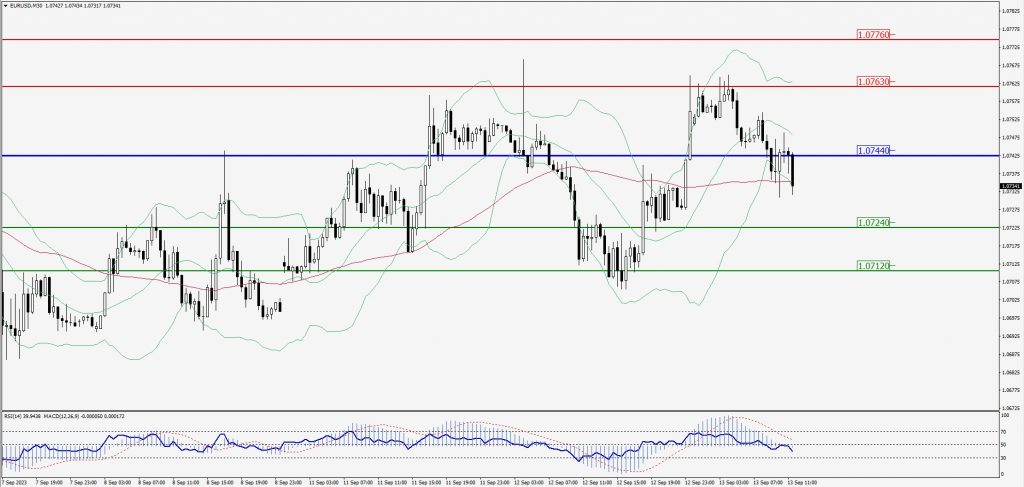
Green Lines Indicate Resistance Levels – Red Lines Indicate Support Levels
Light Blue is a Pivot Point – Black represents the price when the report was produced
GBP/USD Intraday: Trend on the downside
Our pivot point is at 1.25200
Preferable Price Action: Sell positions below pivot with targets at 1.24550 & 1.24330 in extension.
Alternative Price Action: The price above pivot would call for further upside to 1.25260 & 1.25500.
Comment: RSI is below 50 levels and Pairs below its 20MA & 55MA.
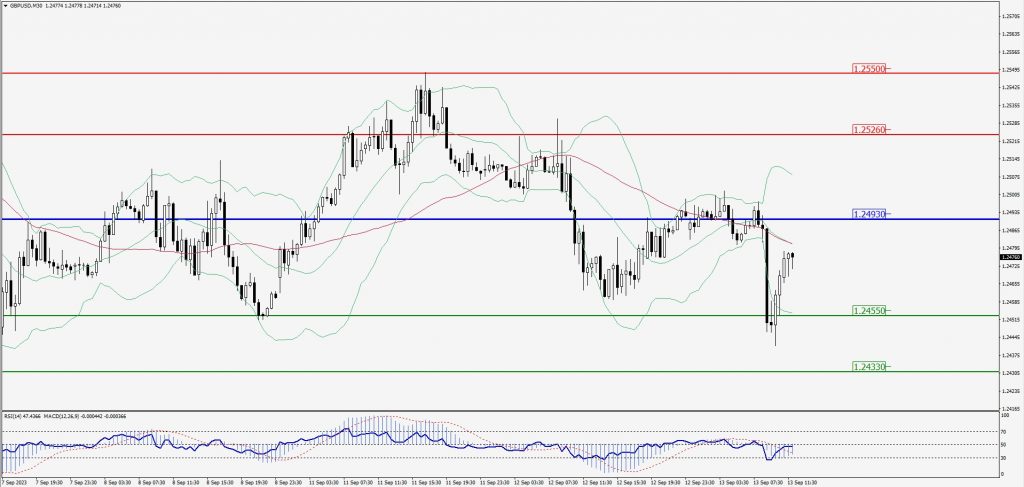
Green Lines Indicate Resistance Levels – Red Lines Indicate Support Levels
Light Blue is a Pivot Point – Black represents the price when the report was produced
USD/JPY Intraday: Trend on the upside
Our pivot point is at 147.160
Preferable Price Action: Buy position above pivot with the target at 147.500 and 147.710 in extension.
Alternative Price Action: The downside breakout of the pivot would call for 146.860 and 146.640.
Comment: MACD is above 50 level and Pairs above 55MA.
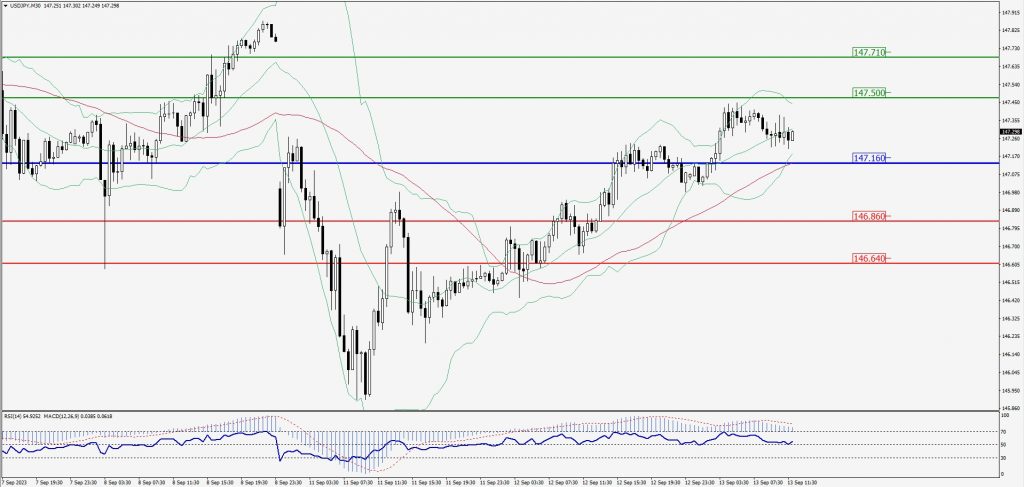
Green Lines Indicate Resistance Levels – Red Lines Indicate Support Levels
Light Blue is a Pivot Point – Black represents the price when the report was produced
AUD/USD Intraday: In a consolidation zone
Our pivot point is at 0.64200
Preferable Price Action: Sell positions below pivot with targets at 0.63990 & 0.63860 in extension.
Alternative Price Action: Above pivot looks for a further upside with 0.64410 & 0.64540 as targets.
Comment: RSI is at 50 levels and Pairs below 55MA.
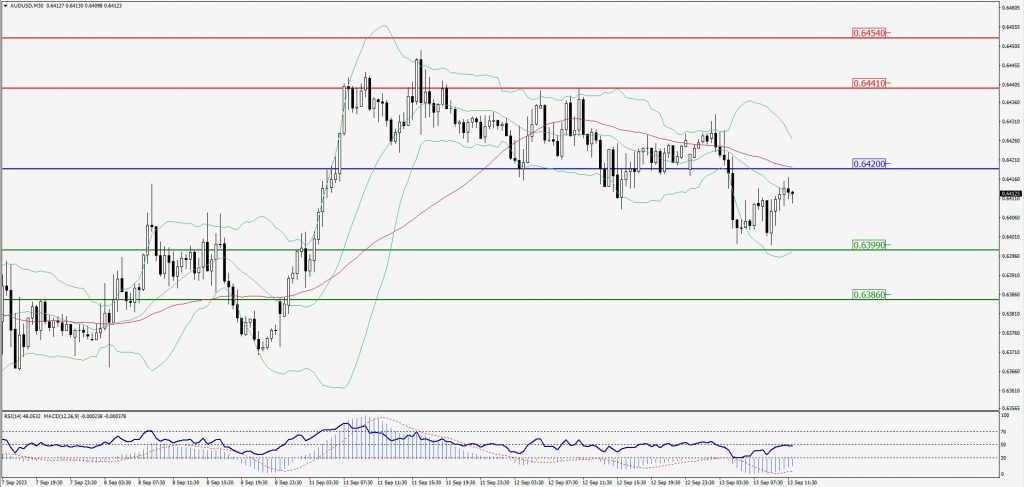
Green Lines Indicate Resistance Levels – Red Lines Indicate Support Levels
Light Blue is a Pivot Point – Black represents the price when the report was produced
CRUDEOIL Intraday: Major trend on the upside
Our pivot point is at 88.57
Preferable Price Action: Above pivot buy oil with 89.31 & 89.80 as targets.
Alternative Price Action: Sell crude below pivot with targets at 87.88 and 87.35 in extension.
Comment: MACD is positive territory and Pairs above its 20MA & 55MA.
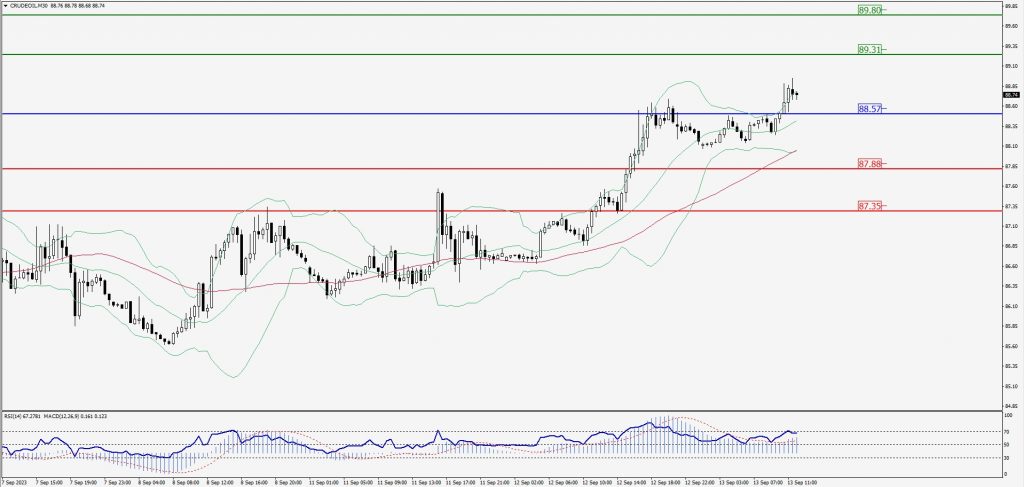
Green Lines Indicate Resistance Levels – Red Lines Indicate Support Levels
Light Blue is a Pivot Point – Black represents the price when the report was produced
XAU/USD Intraday: Trend on the downside
Our pivot point is 1913.50
Preferable Price Action: Further downside to 1907.70 and 1904.00.
Alternative Price Action: If the price gives an upside breakout of a pivot, then the price extends to 1918.40 and 1922.30.
Comment: MACD is below 50 level and Pairs below 55MA.
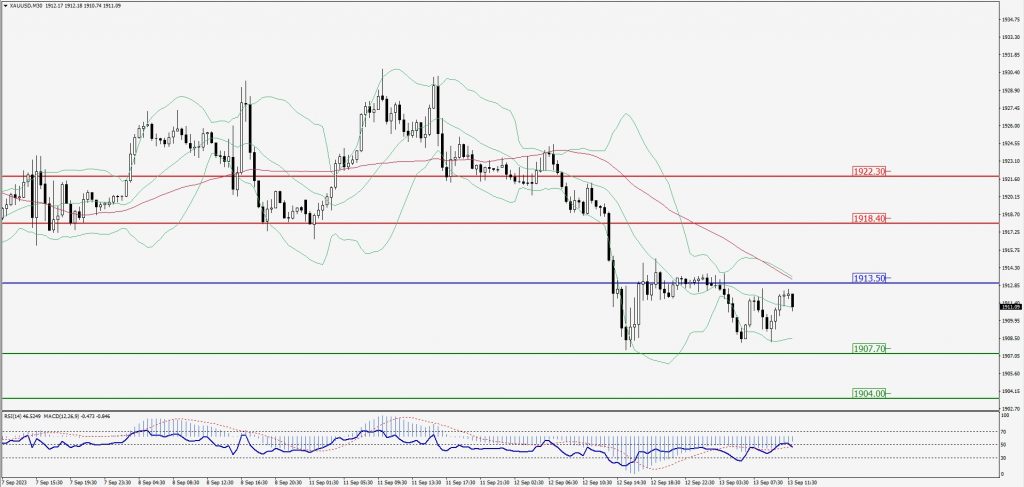
Green Lines Indicate Resistance Levels – Red Lines Indicate Support Levels
Light Blue is a Pivot Point – Black represents the price when the report was produced
Dow Jones Intraday: Resistance level at 34,650.00
Our pivot point is 34,650.00
Preferable Price Action: Take sell positions below the pivot with targets at 34,549.00 & 34,476.00.
Alternative Price Action: Above 34,650.00 looks for further upside to 34,749.00 & 34,824.00.
Comment: RSI is below 50 levels and Pairs below 55MA.
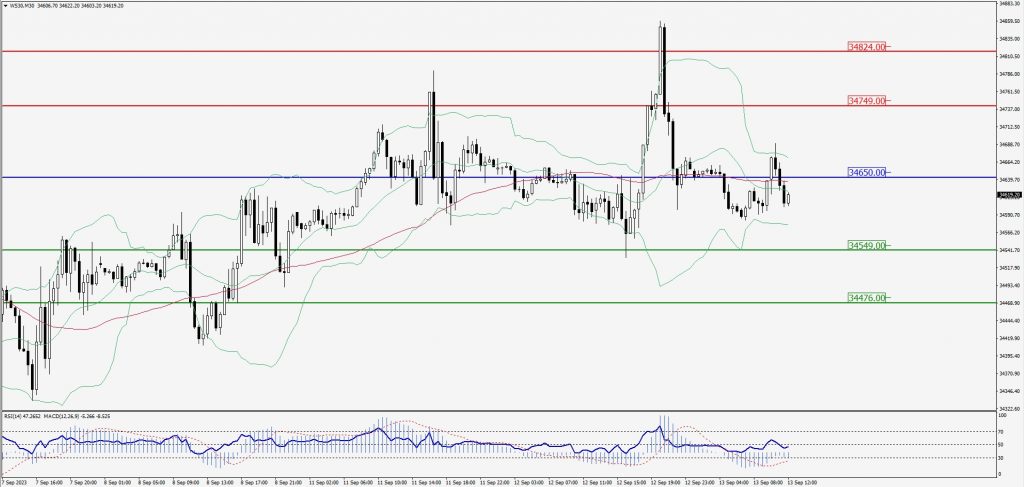
Green Lines Indicate Resistance Levels – Red Lines Indicate Support Levels
Light Blue is a Pivot Point – Black represents the price when the report was produced