Market Wrap: Stocks, Bonds, Commodities
U.S. stock futures were little changed during Monday night trade after major benchmark averages posted a positive session, led by gains in Tesla Inc after an upgrade from Morgan Stanley analysts, with participants looking ahead to key inflation data set for release later in the week.
The Dow Jones Industrial Average rose 87.13 points to 34,663.72, the S&P 500 gain 0.67% to 4,487.46 and the Nasdaq Composite add 156.37 points to 13,917.89.
MSCI’s index of Asia-Pacific stocks outside Japan is decline 0.02% to 620.43 levels. The Australian index was higher by 0.20% to 7,206.90. Japanese Nikkei Index ascend 0.97% today.
European stocks were positive on Tuesday, with the Stoxx Europe 50 Index rose 0.44% to 4,255.75, Germany’s DAX ascend 0.36% to 15,800.99, and France’s CAC advance 0.52% to 7,278.27 and U.K.’s FTSE 100 add 0.25% to 7,496.87.
Benchmark 10-year U.S. Treasury fell as demand for safe assets ascend again, today 10-year bond yields positive 0.12% to 4.2930.
Oil prices moved little in Asian trade on Tuesday as markets awaited forecasts on supply and demand from an OPEC report due later in the day, although optimism over recent supply cuts kept prices near 10-month highs.
Spot Brent crude oil ascend 0.19% to $90.80 per barrel. US West Texas Intermediate crude is up 0.27% to $87.54 a barrel.
The yellow metal gold is decline 0.23% to 1,942.75 dollars per ounce.
Market Wrap: Forex
The U.S. dollar fell in early European trade Monday, retreating from a six-month high, while the Japanese yen surged as comments from Bank of Japan Governor Kazuo Ueda signaled a potential change in monetary policy.
Today, the U.S. dollar index measures the Greenback against a trade-weighted basket of six major currencies, which surged 0.12% to 104.300.
The Euro US Dollar (EUR/USD) is a widely traded pair that is down 0.14% today. This left the pair trading around $1.07320.
The Japanese yen was negative against the U.S. dollar on Tuesday. Today USD/JPY is surged 0.19% to the 146.880 level.
Another commodity-related currency mixed against the U.S dollar, AUD/USD rose 0.03% to 0.64330, and NZD/USD slipped 0.08% to 0.59120 level.
EUR/USD Intraday: Trend on the downside
Our pivot point is at 1.07440
Preferable Price Action: Take sell positions below pivot level with targets at 1.07240 & 1.07120 in extension.
Alternative Price Action: Above pivot looks for a further upside to 1.07630 & 1.07760.
Comment: RSI is below 50 levels and Pairs below 20MA.
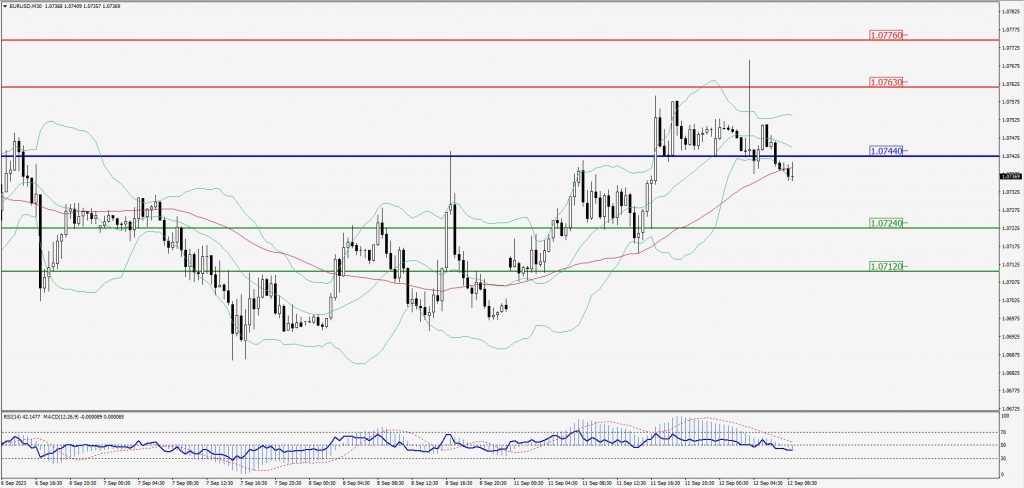
Green Lines Indicate Resistance Levels – Red Lines Indicate Support Levels
Light Blue is a Pivot Point – Black represents the price when the report was produced
GBP/USD Intraday: Resistance level at 1.25200
Our pivot point is at 1.25200
Preferable Price Action: Sell positions below pivot with targets at 1.24880 & 1.24690 in extension.
Alternative Price Action: The price above pivot would call for further upside to 1.25510 & 1.25720.
Comment: RSI is below 50 levels and Pairs below 55MA.
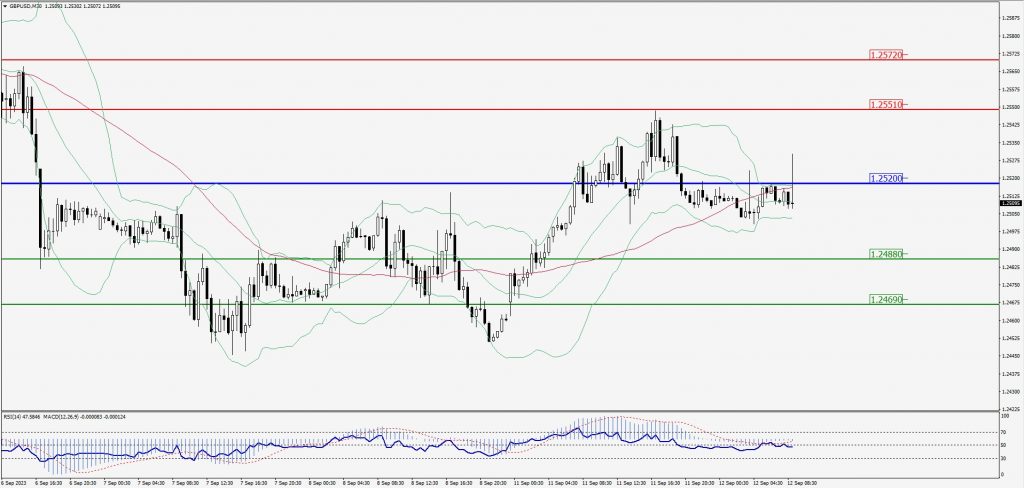
Green Lines Indicate Resistance Levels – Red Lines Indicate Support Levels
Light Blue is a Pivot Point – Black represents the price when the report was produced
USD/JPY Intraday: Trend on the upside
Our pivot point is at 146.760
Preferable Price Action: Buy position above pivot with the target at 147.140 and 147.400 in extension.
Alternative Price Action: The downside breakout of the pivot would call for 146.380 and 146.130.
Comment: MACD is above 50 level and Pairs above its 20MA & 55MA.
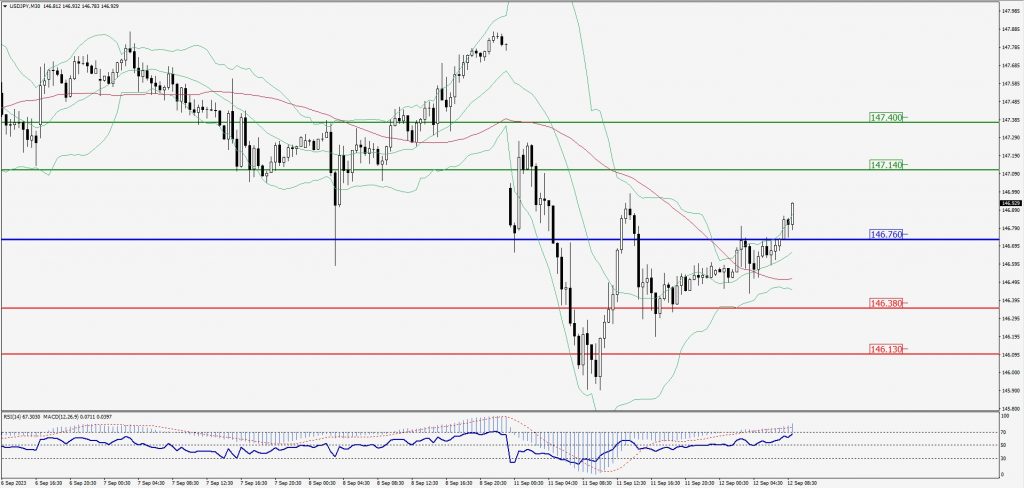
Green Lines Indicate Resistance Levels – Red Lines Indicate Support Levels
Light Blue is a Pivot Point – Black represents the price when the report was produced
AUD/USD Intraday: In a consolidation zone
Our pivot point is at 0.64370
Preferable Price Action: Sell positions below pivot with targets at 0.64170 & 0.64040 in extension.
Alternative Price Action: Above pivot looks for a further upside with 0.64530 & 0.64640 as targets.
Comment: RSI is at 50 levels and Pairs below 55MA.
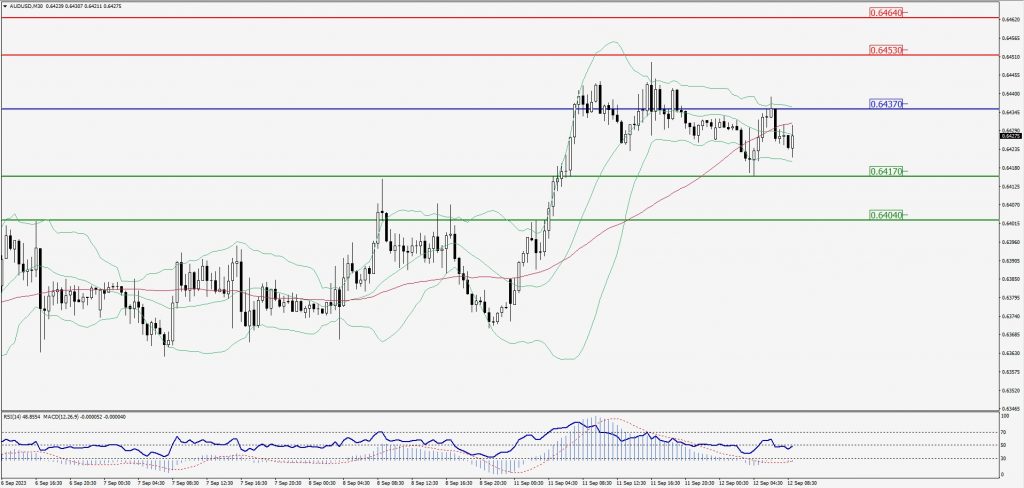
Green Lines Indicate Resistance Levels – Red Lines Indicate Support Levels
Light Blue is a Pivot Point – Black represents the price when the report was produced
CRUDEOIL Intraday: Support level at 86.73
Our pivot point is at 86.73
Preferable Price Action: Above pivot buy oil with 87.51 & 88.03 as targets.
Alternative Price Action: Sell crude below pivot with targets at 86.08 and 85.56 in extension.
Comment: MACD is positive territory and Pairs above its 20MA & 55MA.
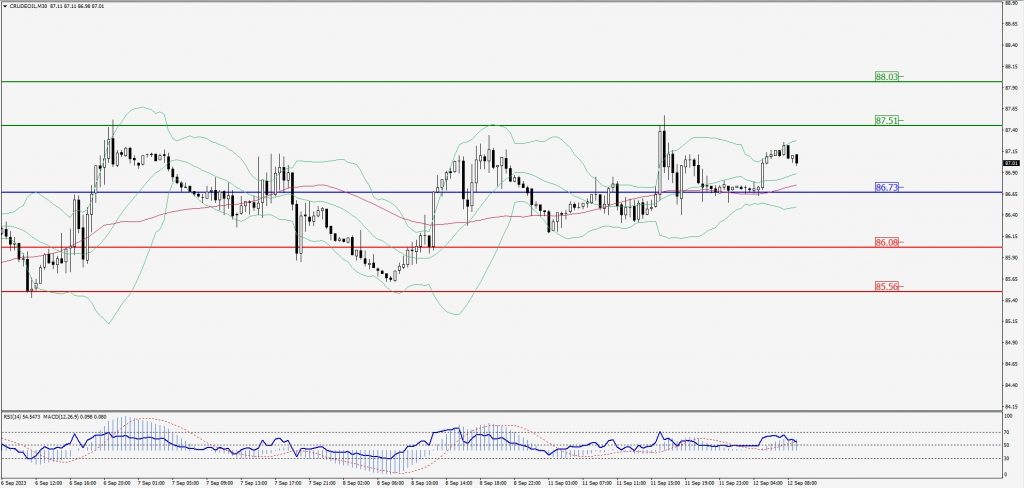
Green Lines Indicate Resistance Levels – Red Lines Indicate Support Levels
Light Blue is a Pivot Point – Black represents the price when the report was produced
XAU/USD Intraday: Trend on the downside
Our pivot point is 1920.90
Preferable Price Action: Further downside to 1916.60 and 1914.30.
Alternative Price Action: If the price gives an upside breakout of a pivot, then the price extends to 1924.30 and 1926.90.
Comment: MACD is below 50 level and Pairs below its 20MA & 55MA.
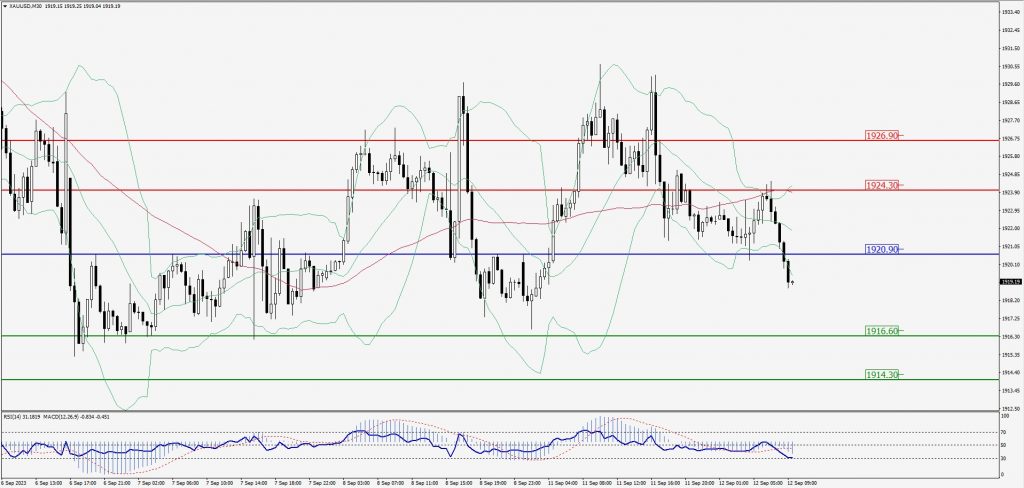
Green Lines Indicate Resistance Levels – Red Lines Indicate Support Levels
Light Blue is a Pivot Point – Black represents the price when the report was produced
Dow Jones Intraday: Support level at 34,625.00
Our pivot point is 34,625.00
Preferable Price Action: Take Buy positions above the pivot with targets at 34,715.00 & 34,782.00.
Alternative Price Action: Below 34,6525.00 looks for further downside to 34,543.00 & 34,478.00.
Comment: RSI is at 50 levels.
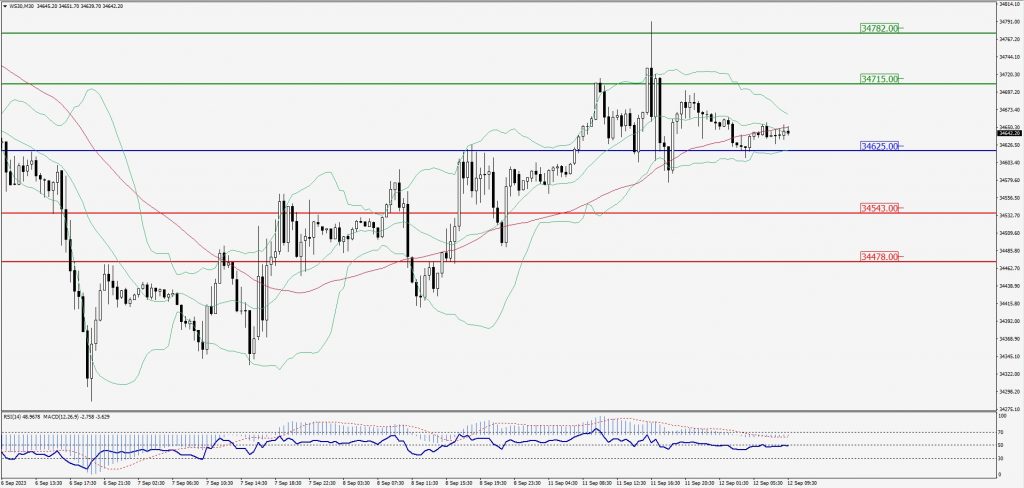
Green Lines Indicate Resistance Levels – Red Lines Indicate Support Levels
Light Blue is a Pivot Point – Black represents the price when the report was produced