Market Wrap: Stocks, Bonds, Commodities
The U.S. State Department will begin offering charter flights to Europe to help Americans leave Israel if they want starting Friday, the White House said, after extensive talks with U.S. airlines and pressure from Congress.
The Dow Jones Industrial Average fell 173.73 points to 33,631.14, the S&P 500 lose 0.62% to 4,349.61 and the Nasdaq Composite subtract 85.46 points to 13,574.22.
MSCI’s index of Asia-Pacific stocks outside Japan is decline 1.24% to 607.99 levels. The Australian index was lower by 0.56% to 7,051.00. Japanese Nikkei Index drop 0.61% today.
European stocks were negative on Friday, with the Stoxx Europe 50 Index fell 0.43% to 4,180.35, Germany’s DAX drop 0.49% to 15,350.63, and France’s CAC decline 0.36% to 7,077.68 and U.K.’s FTSE 100 subtract 0.32% to 7,619.38.
Benchmark 10-year U.S. Treasury fell as demand for safe assets ascend again, today 10-year bond yields negative 1.30% to 4.6490.
Oil prices rose on Thursday, reversing earlier falls, on expectations that U.S. interest rates had peaked, but a lower demand growth forecast for next year from the International Energy Agency and higher U.S. inventories limited further gains.
Spot Brent crude oil ascend 2.87% to $88.47 per barrel. US West Texas Intermediate crude is up 3.03% to $85.42 a barrel.
The yellow metal gold is advance 0.67% to 1,895.55 dollars per ounce.
Market Wrap: Forex
The dollar rose sharply on Thursday after U.S. consumer prices rose more than expected in September, lifted by an elevated cost of rent that raised the prospect of the Federal Reserve keeping interest rates high for some time.
Today, the U.S. dollar index measures the Greenback against a trade-weighted basket of six major currencies, which slipped 0.20% to 106.150.
The Euro US Dollar (EUR/USD) is a widely traded pair that is up 0.23% today. This left the pair trading around $1.05500.
The Japanese yen was negative against the U.S. dollar on Friday. Today USD/JPY is slipped 0.02% to the 149.760 level.
Another commodity-related currency mixed against the U.S dollar, AUD/USD rose 0.05% to 0.63160, and NZD/USD slipped 0.33% to 0.59080 level.
EUR/USD Intraday: Trend on the downside
Our pivot point is at 1.05520
Preferable Price Action: Take sell positions below pivot level with targets at 1.05120 & 1.04910 in extension.
Alternative Price Action: Above pivot looks for a further upside to 1.05830 & 1.06050.
Comment: RSI is below 50 levels and Pairs below 55MA.
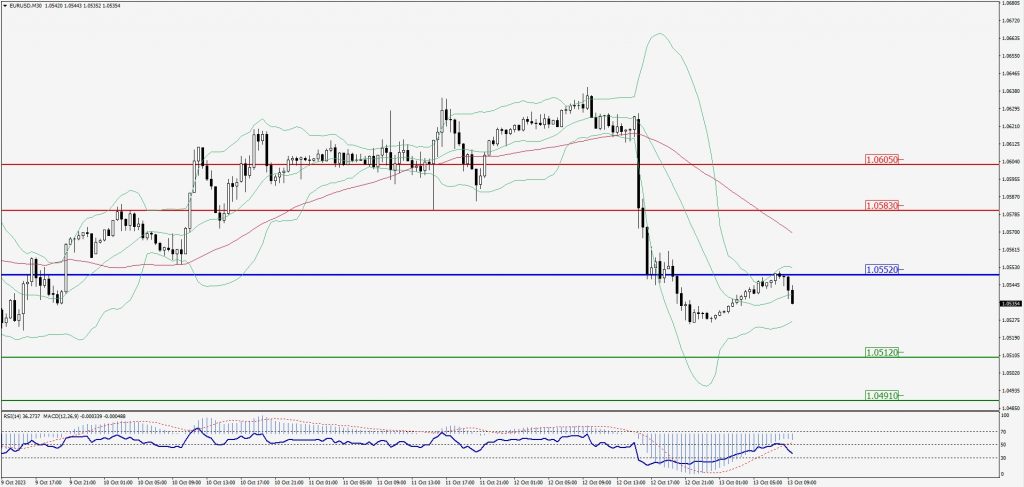
Green Lines Indicate Resistance Levels – Red Lines Indicate Support Levels
Light Blue is a Pivot Point – Black represents the price when the report was produced
GBP/USD Intraday: Trend on the downside
Our pivot point is at 1.22090
Preferable Price Action: Sell positions below pivot with targets at 1.21560 & 1.21260 in extension.
Alternative Price Action: The price above pivot would call for further upside to 1.22560 & 1.22900.
Comment: RSI is below 50 levels and Pairs below 55MA.
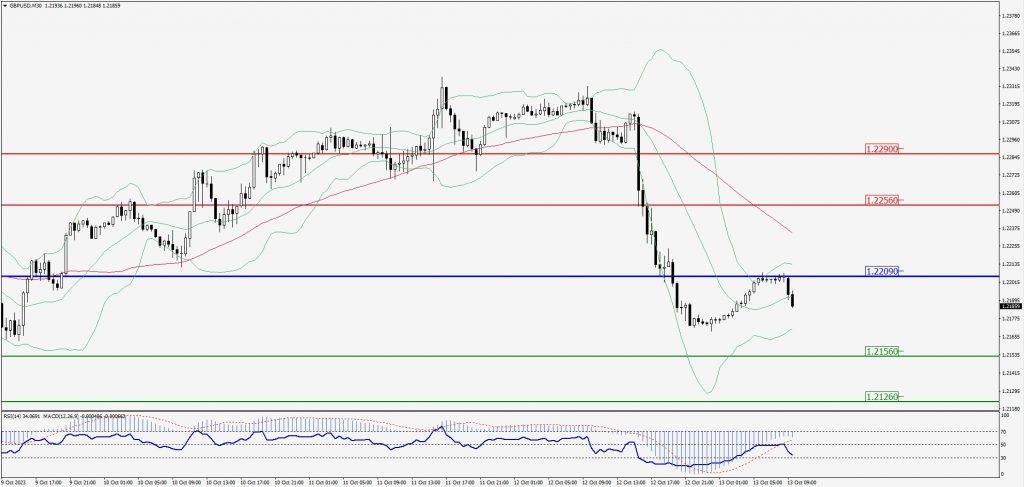
Green Lines Indicate Resistance Levels – Red Lines Indicate Support Levels
Light Blue is a Pivot Point – Black represents the price when the report was produced
USD/JPY Intraday: In a consolidation zone
Our pivot point is at 149.640
Preferable Price Action: Buy position above pivot with the target at 150.120 and 150.430 in extension.
Alternative Price Action: The downside breakout of the pivot would call for 149.240 and 148.950.
Comment: MACD is at 50 level and Pairs above 55MA.
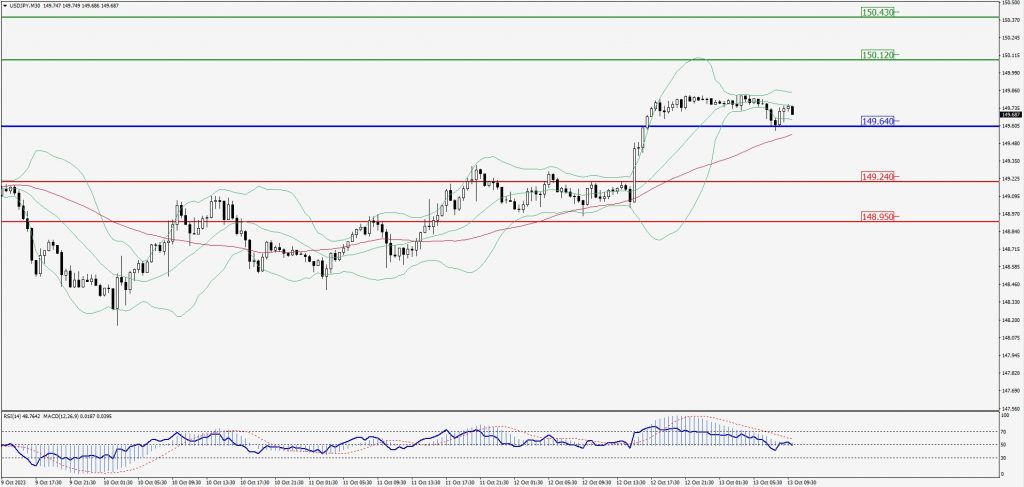
Green Lines Indicate Resistance Levels – Red Lines Indicate Support Levels
Light Blue is a Pivot Point – Black represents the price when the report was produced
AUD/USD Intraday: Trend on the downside
Our pivot point is at 0.63310
Preferable Price Action: Sell positions below pivot with targets at 0.62960 & 0.62750 in extension.
Alternative Price Action: Above pivot looks for a further upside with 0.63620 & 0.63840 as targets.
Comment: RSI is below 50 levels and Pairs below 55MA.
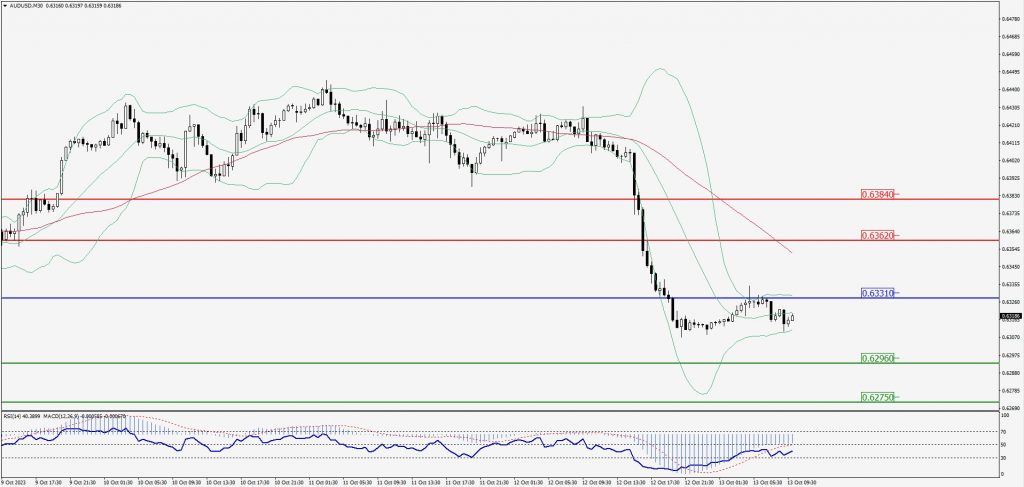
Green Lines Indicate Resistance Levels – Red Lines Indicate Support Levels
Light Blue is a Pivot Point – Black represents the price when the report was produced
CRUDEOIL Intraday: Major trend on the upside
Our pivot point is at 82.87
Preferable Price Action: Above pivot buy oil with 83.77 & 84.29 as targets.
Alternative Price Action: Sell crude below pivot with targets at 82.09 and 81.58 in extension.
Comment: MACD is positive territory and Pairs above its 20MA & 55MA.
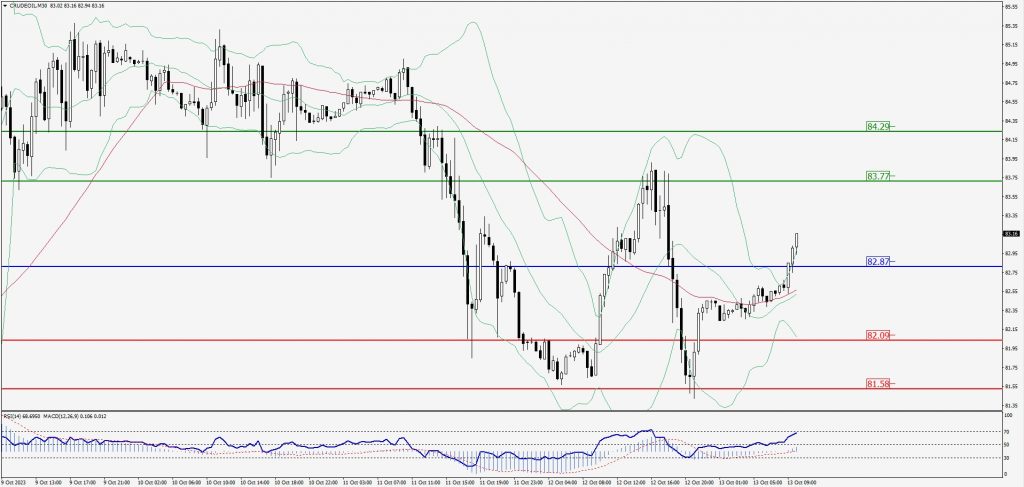
Green Lines Indicate Resistance Levels – Red Lines Indicate Support Levels
Light Blue is a Pivot Point – Black represents the price when the report was produced
XAU/USD Intraday: Trend on the upside
Our pivot point is 1873.60
Preferable Price Action: Further upside to 1886.50 and 1893.60.
Alternative Price Action: If the price gives a downside breakout of a pivot, then the price extends to 1863.10 and 1856.40.
Comment: MACD is above 50 level and Pairs above its 20MA & 55MA.
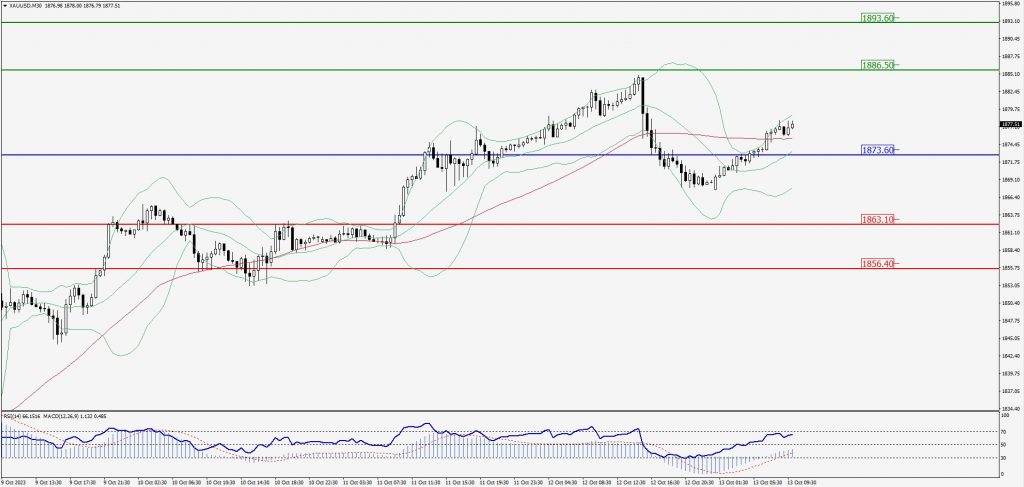
Green Lines Indicate Resistance Levels – Red Lines Indicate Support Levels
Light Blue is a Pivot Point – Black represents the price when the report was produced
Dow Jones Intraday: Support level at 33,665.00
Our pivot point is 33,665.00
Preferable Price Action: Take buy positions above the pivot with targets at 33,830.00 & 33,967.00.
Alternative Price Action: Below 33,665.00 looks for further downside to 33,518.00 & 33,389.00.
Comment: RSI is above 50 levels and Pairs above 20MA.
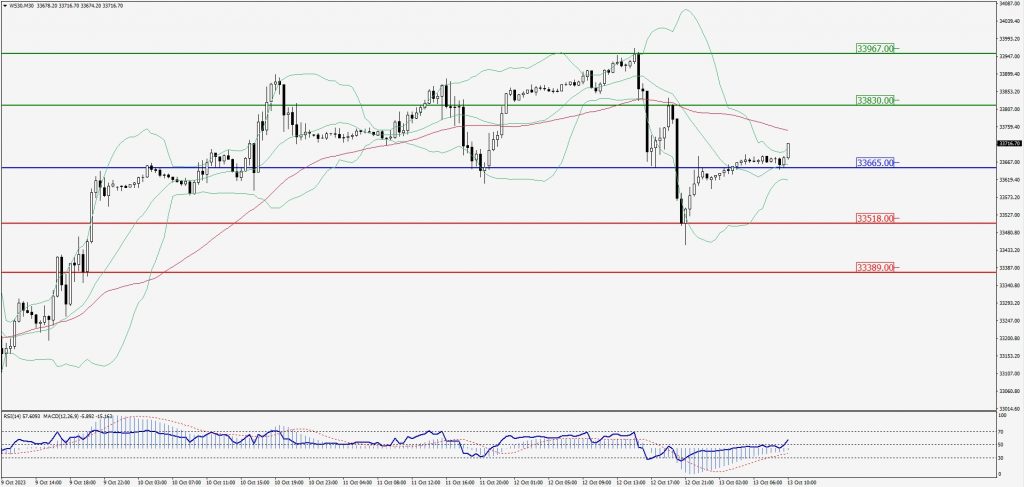
Green Lines Indicate Resistance Levels – Red Lines Indicate Support Levels
Light Blue is a Pivot Point – Black represents the price when the report was produced