Market Wrap: Stocks, Bonds, Commodities
Stocks ticked higher Wednesday as traders awaited the release of new US consumer inflation numbers and Treasury yields continued to retreat.
The Dow Jones Industrial Average rose 65.57 points to 33,804.87, the S&P 500 gain 0.43% to 4,376.95 and the Nasdaq Composite add 96.83 points to 13,659.68.
MSCI’s index of Asia-Pacific stocks outside Japan is advance 1.22% to 617.38 levels. The Australian index was higher by 0.04% to 7,091.00. Japanese Nikkei Index ascend 1.72% today.
European stocks were positive on Thursday, with the Stoxx Europe 50 Index rose 0.51% to 4,222.05, Germany’s DAX ascend 0.41% to 15,522.95, and France’s CAC advance 0.46% to 7,164.04 and U.K.’s FTSE 100 add 0.47% to 7,164.16.
Benchmark 10-year U.S. Treasury fell as demand for safe assets ascend again, today 10-year bond yields negative 0.81% to 4.5580.
Oil prices were little changed in early Asian trade on Wednesday, as concerns eased about potential supply disruptions due to the conflict between Israel and the Palestinian Islamist group Hamas.
Spot Brent crude oil ascend 0.34% to $86.11 per barrel. US West Texas Intermediate crude is up 0.19% to $83.65 a barrel.
The yellow metal gold is advance 0.35% to 1,894.05 dollars per ounce.
Market Wrap: Forex
The dollar was steady on Wednesday after a core reading of U.S. producer prices showed underlying inflation moderated further in September, leading the market to reason the Federal Reserve is done hiking interest rates.
Today, the U.S. dollar index measures the Greenback against a trade-weighted basket of six major currencies, which slipped 0.16% to 105.400.
The Euro US Dollar (EUR/USD) is a widely traded pair that is up 0.13% today. This left the pair trading around $1.06310.
The Japanese yen was negative against the U.S. dollar on Thursday. Today USD/JPY is slipped 0.03% to the 149.110 level.
Another commodity-related currency mixed against the U.S dollar, AUD/USD rose 0.05% to 0.64170, and NZD/USD slipped 0.16% to 0.60080 level.
EUR/USD Intraday: Trend on the upside
Our pivot point is at 1.06240
Preferable Price Action: Take buy positions above pivot level with targets at 1.06600 & 1.06820 in extension.
Alternative Price Action: Below pivot looks for a further downside to 1.05940 & 1.05730.
Comment: RSI is above 50 levels and Pairs above its 20MA & 55MA.
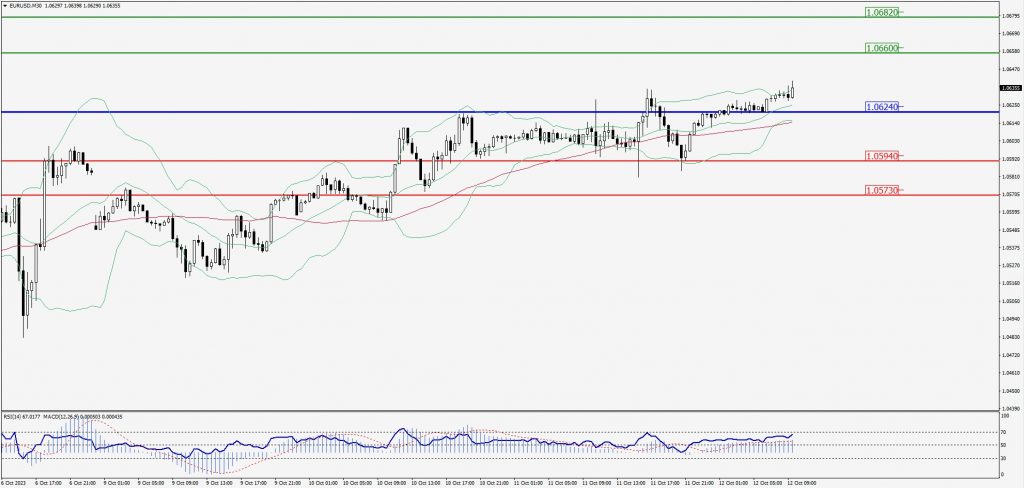
Green Lines Indicate Resistance Levels – Red Lines Indicate Support Levels
Light Blue is a Pivot Point – Black represents the price when the report was produced
GBP/USD Intraday: Trend on the upside
Our pivot point is at 1.23130
Preferable Price Action: Buy positions above pivot with targets at 1.23580 & 1.23890 in extension.
Alternative Price Action: The price below pivot would call for further downside to 1.22750 & 1.22470.
Comment: RSI is above 50 levels and Pairs above its 20MA & 55MA.
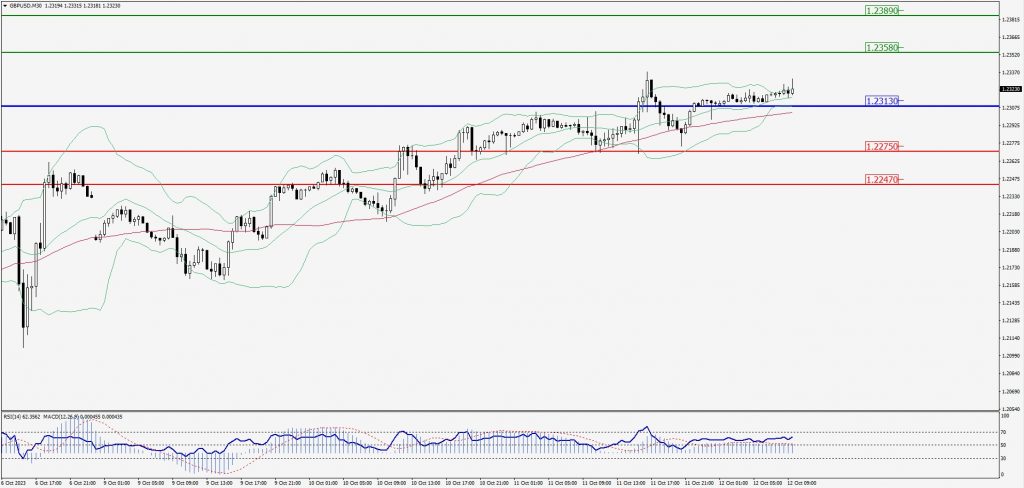
Green Lines Indicate Resistance Levels – Red Lines Indicate Support Levels
Light Blue is a Pivot Point – Black represents the price when the report was produced
USD/JPY Intraday: Resistance level at 149.180
Our pivot point is at 149.180
Preferable Price Action: Sell position below pivot with the target at 148.800 and 148.580 in extension.
Alternative Price Action: The upside breakout of the pivot would call for 149.520 and 149.770.
Comment: MACD is below 50 level and Pairs below 20MA.
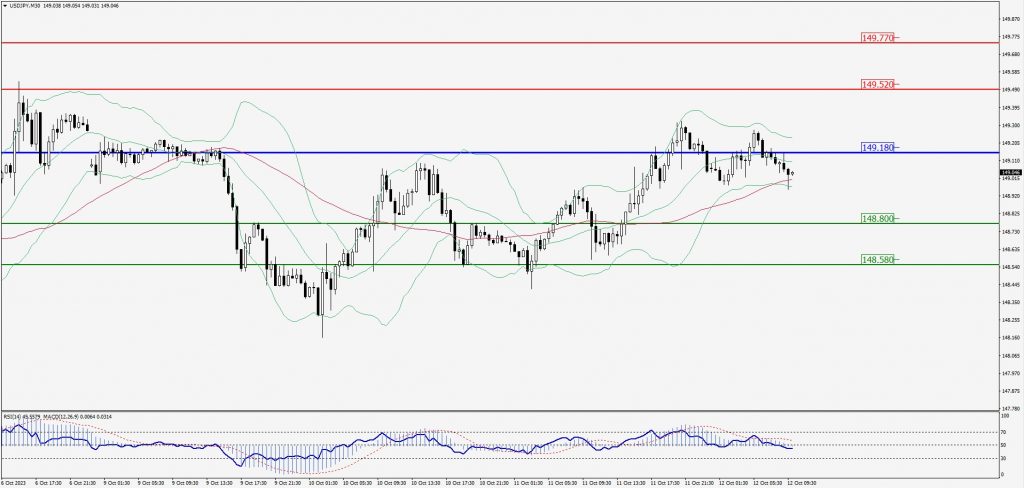
Green Lines Indicate Resistance Levels – Red Lines Indicate Support Levels
Light Blue is a Pivot Point – Black represents the price when the report was produced
AUD/USD Intraday: Major support level at 0.64150
Our pivot point is at 0.64150
Preferable Price Action: Buy positions above pivot with targets at 0.64480 & 0.64750 in extension.
Alternative Price Action: Below pivot looks for a further downside with 0.63850 & 0.63620 as targets.
Comment: RSI is above 50 levels and Pairs above 55MA.
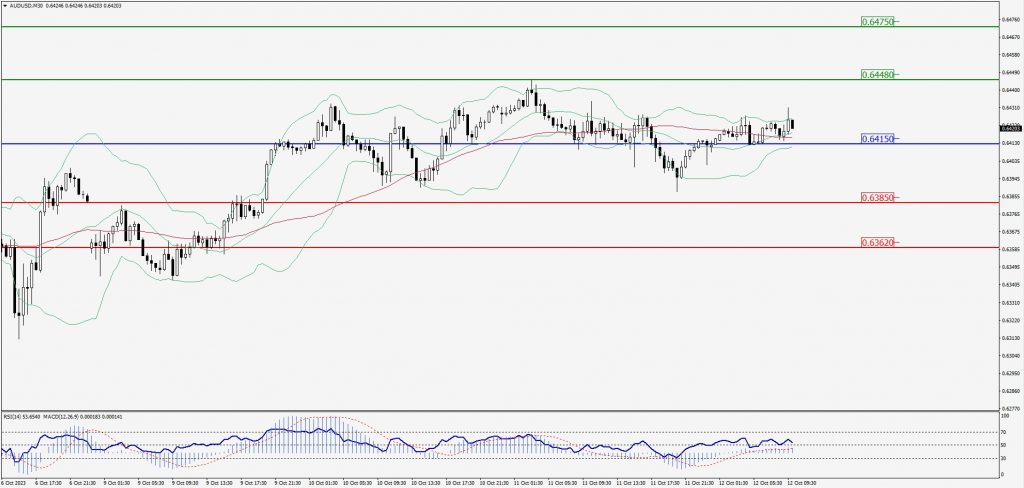
Green Lines Indicate Resistance Levels – Red Lines Indicate Support Levels
Light Blue is a Pivot Point – Black represents the price when the report was produced
CRUDEOIL Intraday: Trend on the downside
Our pivot point is at 81.78
Preferable Price Action: Below pivot sell oil with 80.43 & 79.54 as targets.
Alternative Price Action: Buy crude above pivot with targets at 83.05 and 83.97 in extension.
Comment: MACD is negative territory and Pairs below 55MA.
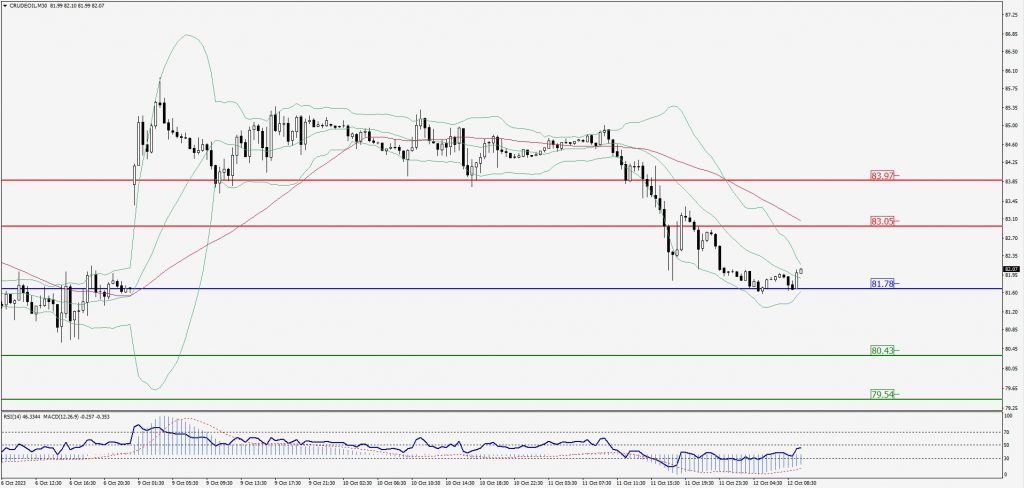
Green Lines Indicate Resistance Levels – Red Lines Indicate Support Levels
Light Blue is a Pivot Point – Black represents the price when the report was produced
XAU/USD Intraday: Major trend on the upside
Our pivot point is 1876.90
Preferable Price Action: Further upside to 1895.00 and 1907.10.
Alternative Price Action: If the price gives a downside breakout of a pivot, then the price extends to 1861.20 and 1848.90.
Comment: MACD is above 50 level and Pairs above its 20MA & 55MA.
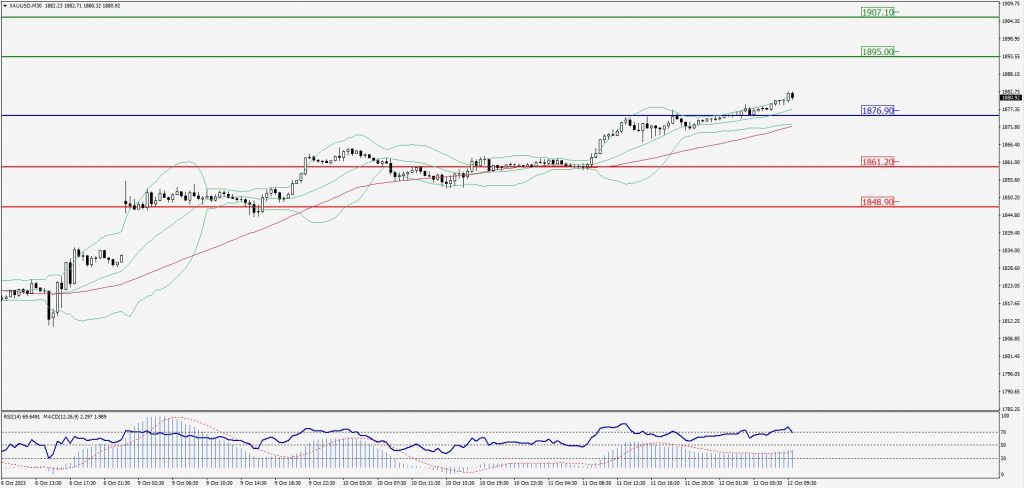
Green Lines Indicate Resistance Levels – Red Lines Indicate Support Levels
Light Blue is a Pivot Point – Black represents the price when the report was produced
Dow Jones Intraday: Trend on the upside
Our pivot point is 33,852.00
Preferable Price Action: Take buy positions above the pivot with targets at 34,114.00 & 34,269.00.
Alternative Price Action: Below 33,852.00 looks for further downside to 33,632.00 & 33,459.00.
Comment: RSI is above 50 levels and Pairs above its 20MA & 55MA.
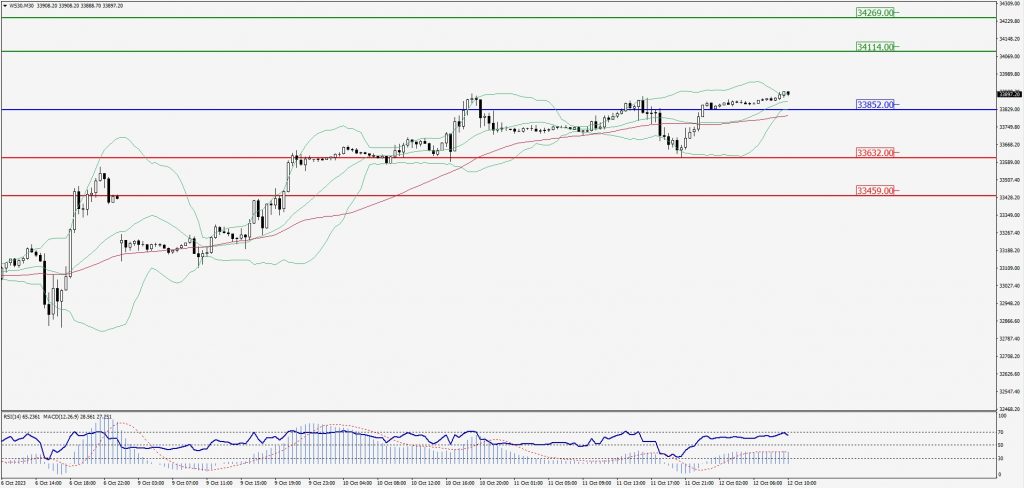
Green Lines Indicate Resistance Levels – Red Lines Indicate Support Levels
Light Blue is a Pivot Point – Black represents the price when the report was produced