Market Wrap: Stocks, Bonds, Commodities
US stocks closed sharply lower and Treasury yields extended their slide on Friday over fears of contagion in the financial sector and strong February employment data showing that the economy added more jobs than expected.
The Dow Jones Industrial Average fell 545.22 points to 31,909.64, the S&P 500 lose 1.45% to 3,861.59 and the Nasdaq Composite subtract 199.47 points to 11,138.89
MSCI’s index of Asia-Pacific stocks outside Japan is advance 1.24% to 623.80 levels. The Australian index was lower by 0.50% to 7,108.80. Japanese Nikkei Index fell 1.11% today.
European stocks were negative on Monday, with the Stoxx Europe 50 Index lose 1.28% to 4,175.15, Germany’s DAX decline 1.13% to 15,247.45, and France’s CAC drop 1.25% to 7,130.07, and U.K.’s FTSE 100 subtract 1.10% to 7,662.20.
Benchmark 10-year U.S. Treasury fell as demand for safe assets ascend again, today 10-year bond yields are negative 1.35% to 3.6450.
Oil prices slipped in Monday Asian morning trade as concerns about possible further U.S. interest rate hikes continue to rattle investors, though a recovery in Chinese demand and a weaker dollar provided some support.
Spot Brent crude oil fell 0.19% to $82.62 per barrel. US West Texas Intermediate crude is down 0.21% to $76.50 a barrel.
The yellow metal gold is advance 0.87% to 1,883.50 dollars per ounce.
Market Wrap: Forex
The U.S. dollar slipped lower in early European trade Monday as traders reassessed the likelihood of another rate hike by the Federal Reserve later this month given the ongoing U.S. banking crisis.
Today, the U.S. dollar index measures the Greenback against a trade-weighted basket of six major currencies, which slipped 0.48% to 103.650.
The Euro US Dollar (EUR/USD) is a widely traded pair that is up 0.59% today. This left the pair trading around $1.07080.
The Japanese yen was negative against the U.S. dollar on Monday. Today USD/JPY is slipped 0.80% to the 133.940 level.
Another commodity-related currency positive against the U.S dollar, AUD/USD rose 1.25% to 0.66600, and NZD/USD rose 0.91% to 0.61940 level.
EUR/USD Intraday: Trend on the upside
Our pivot point is at 1.07160
Preferable Price Action: Take long positions above pivot level with targets at 1.07600 & 1.07870 in extension.
Alternative Price Action: Below pivot looks for a further downside to 1.06780 & 1.06500.
Comment: RSI is above 50 levels and Pairs above its 20MA & 55MA.
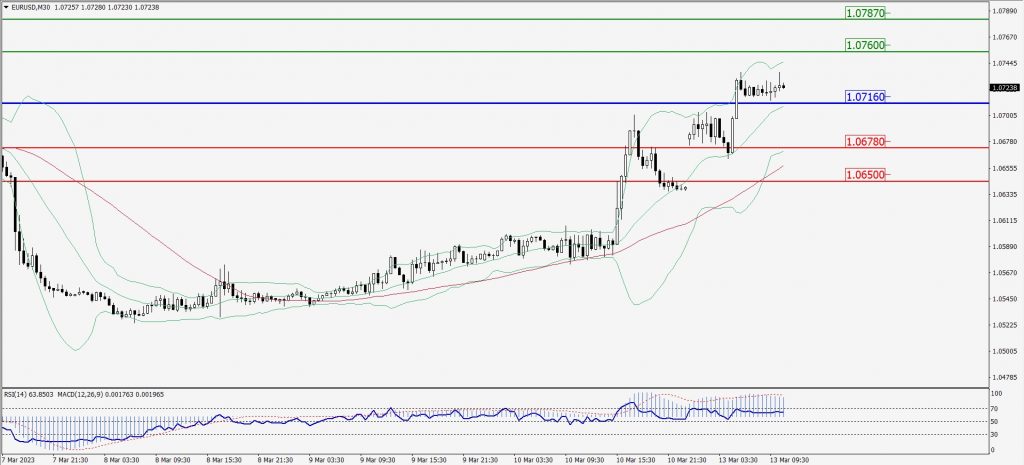
Green Lines Indicate Resistance Levels – Red Lines Indicate Support Levels
Light Blue is a Pivot Point – Black represents the price when the report was produced
GBP/USD Intraday: Trend on the upside
Our pivot point is at 1.20710
Preferable Price Action: Buy positions above pivot with targets at 1.21450 & 1.21940 in extension.
Alternative Price Action: The price below pivot would call for further downside to 1.20090 & 1.19670.
Comment: RSI is above 50 levels and Pairs above 55MA.
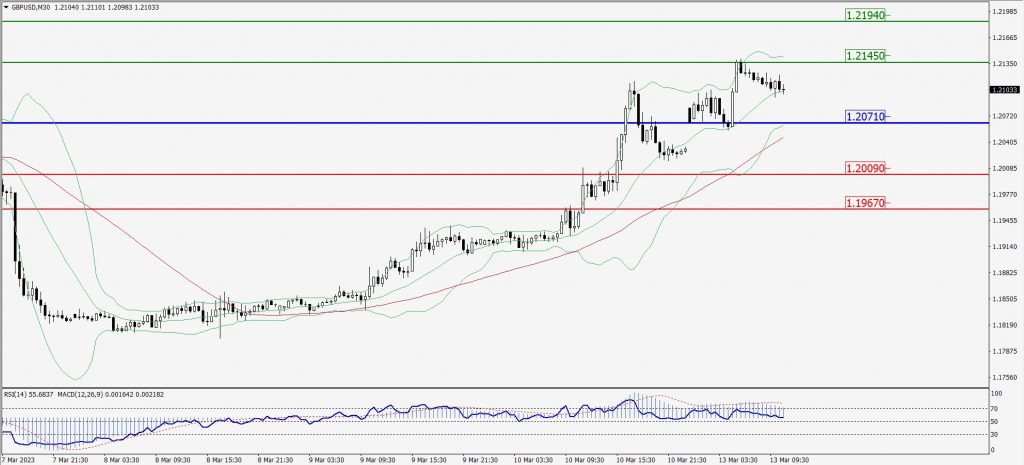
Green Lines Indicate Resistance Levels – Red Lines Indicate Support Levels
Light Blue is a Pivot Point – Black represents the price when the report was produced
USD/JPY Intraday: In a consolidation zone
Our pivot point is at 134.470
Preferable Price Action: Buy position above pivot with the target at 135.110 and 135.550 in extension.
Alternative Price Action: The downside breakout of the pivot would call for 133.850 and 133.420.
Comment: MACD is at 50 level and Pairs above 20MA.
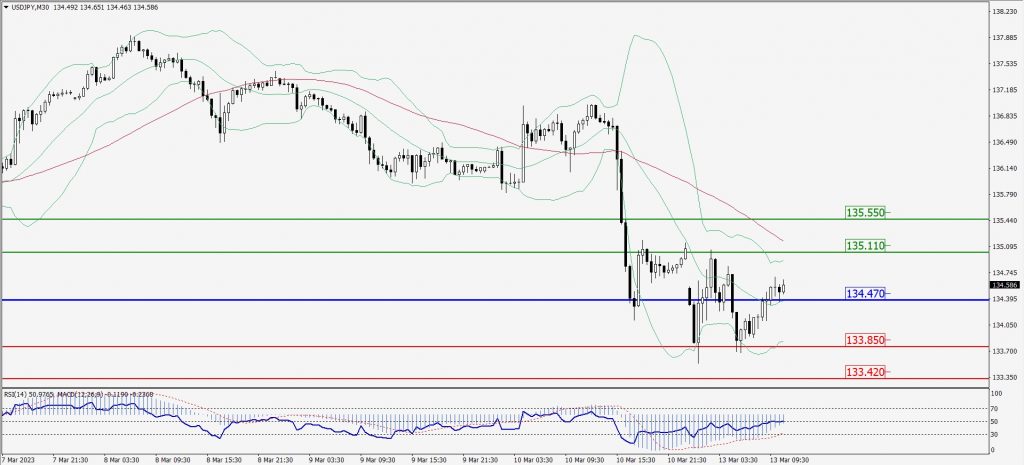
Green Lines Indicate Resistance Levels – Red Lines Indicate Support Levels
Light Blue is a Pivot Point – Black represents the price when the report was produced
AUD/USD Intraday: Trend on the upside
Our pivot point is at 0.66590
Preferable Price Action: Buy positions above pivot with targets at 0.67040 & 0.67350 in extension.
Alternative Price Action: Below pivot looks for a further downside with 0.66220 & 0.65950 as targets.
Comment: RSI is above 50 levels and pairs above its 20MA & 55MA.
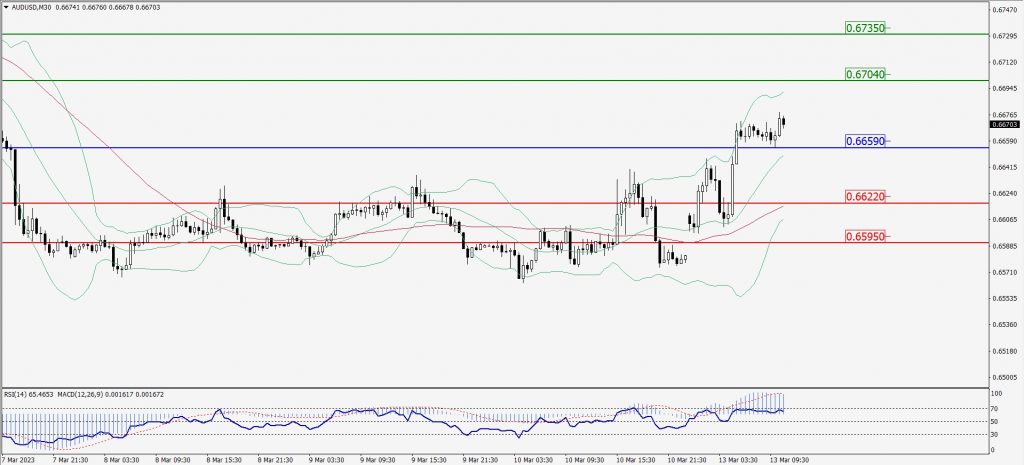
Green Lines Indicate Resistance Levels – Red Lines Indicate Support Levels
Light Blue is a Pivot Point – Black represents the price when the report was produced
CRUDEOIL Intraday: Support level at 76.86
Our pivot point is at 76.86
Preferable Price Action: Above pivot buy oil with 77.88 & 78.52 as targets.
Alternative Price Action: Sell crude below pivot with targets at 76.04 and 75.37 in extension.
Comment: MACD is positive territory and Pairs above its 20MA & 55MA.
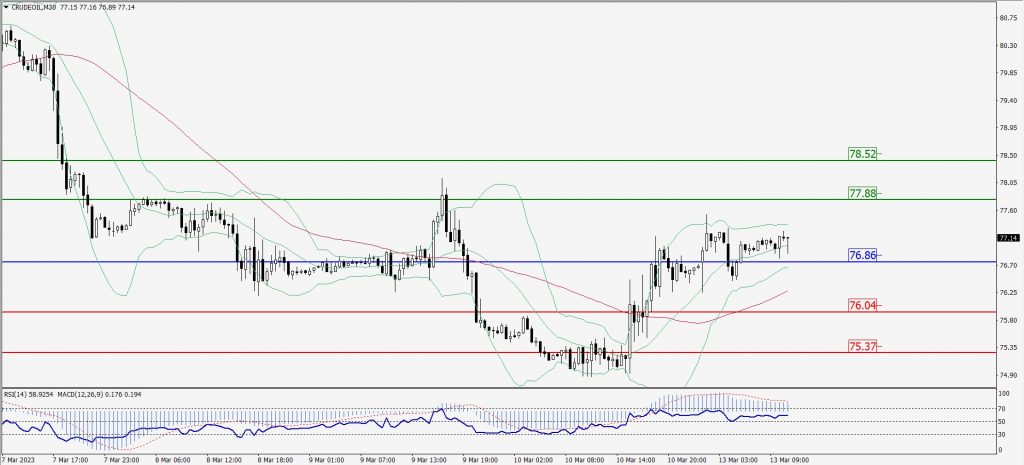
Green Lines Indicate Resistance Levels – Red Lines Indicate Support Levels
Light Blue is a Pivot Point – Black represents the price when the report was produced
XAU/USD Intraday: Trend on the upside
Our pivot point is 1874.60
Preferable Price Action: Further upside to 1892.00 and 1903.80
Alternative Price Action: If the price gives a downside breakout of a pivot, then the price extends to 1859.90 and 1847.90.
Comment: MACD is above 50 level and Pairs above 55MA.
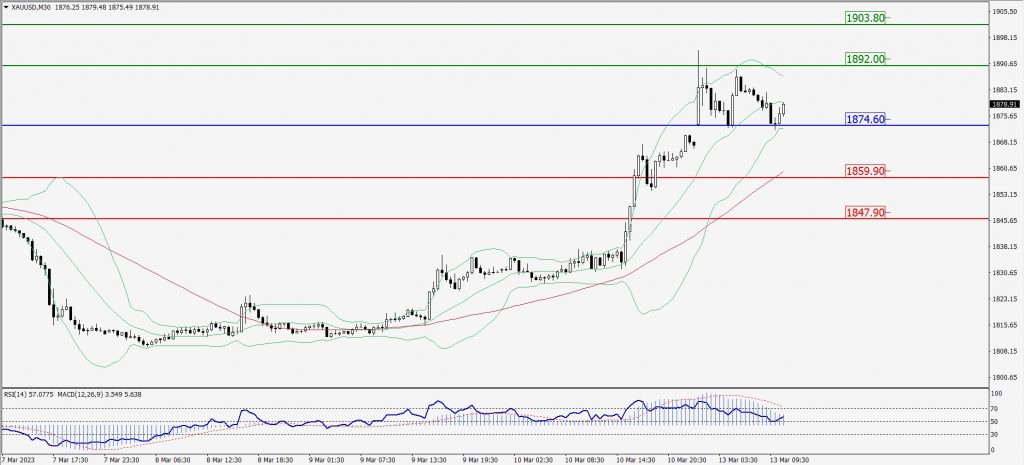
Green Lines Indicate Resistance Levels – Red Lines Indicate Support Levels
Light Blue is a Pivot Point – Black represents the price when the report was produced
Dow Jones Intraday: Trend on the downside
Our pivot point is 32,382.00
Preferable Price Action: Take sell positions below the pivot with targets at 32,052.00 & 31,822.00.
Alternative Price Action: Above 32,382.00 looks for further downside to 32,756.00 & 33,029.00.
Comment: RSI is below 50 levels and Pairs below 20MA.
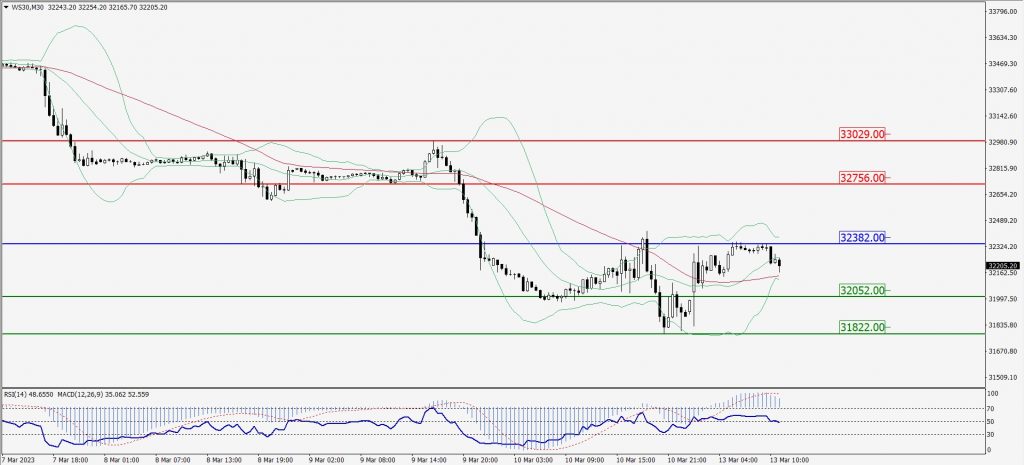
Green Lines Indicate Resistance Levels – Red Lines Indicate Support Levels
Light Blue is a Pivot Point – Black represents the price when the report was produced