Market Wrap: Stocks, Bonds, Commodities
Wall Street’s three major stock indices closed lower on Thursday, with bank stocks creating the biggest drag, while investors also worried that Friday’s jobs report could spur more aggressive interest rate hikes from the Federal Reserve.
The Dow Jones Industrial Average fell 543.54 points to 32,254.86, the S&P 500 lose 1.85% to 3,918.32 and the Nasdaq Composite subtract 237.65 points to 11,338.36
MSCI’s index of Asia-Pacific stocks outside Japan is decline 1.70% to 615.78 levels. The Australian index was lower by 2.28% to 7,144.70. Japanese Nikkei Index fell 1.67% today.
European stocks were negative on Friday, with the Stoxx Europe 50 Index lose 1.90% to 4,204.55, Germany’s DAX decline 1.69% to 15,367.05, and France’s CAC drop 1.78% to 7,185.01, and U.K.’s FTSE 100 subtract 1.78% to 7,739.60.
Benchmark 10-year U.S. Treasury fell as demand for safe assets ascend again, today 10-year bond yields are negative 2.68% to 3.8180.
Oil prices slid about 1 percent to a two-week low on Thursday on increased worries the US Federal Reserve may go too far with its interest rate hikes to control inflation, which could cause a recession and reduce future oil demand.
Spot Brent crude oil fell 0.96% to $80.81 per barrel. US West Texas Intermediate crude is down 1.11% to $74.84 a barrel.
The yellow metal gold is advance 0.19% to 1,838.15 dollars per ounce.
Market Wrap: Forex
The U.S. dollar edged lower in early European trade Friday ahead of the key monthly jobs report, and the yen weakened after the Bank of Japan retained its ultra-dovish stance.
Today, the U.S. dollar index measures the Greenback against a trade-weighted basket of six major currencies, which slipped 0.05% to 105.260.
The Euro US Dollar (EUR/USD) is a widely traded pair that is up 0.06% today. This left the pair trading around $1.05870.
The Japanese yen was negative against the U.S. dollar on Friday. Today USD/JPY is surged 0.17% to the 136.370 level.
Another commodity-related currency mixed against the U.S dollar, AUD/USD fell 0.15% to 0.65800, and NZD/USD rose 0.16% to 0.61090 level.
EUR/USD Intraday: Support level at 1.05860
Our pivot point is at 1.05860
Preferable Price Action: Take long positions above pivot level with targets at 1.06250 & 1.06540 in extension.
Alternative Price Action: Below pivot looks for a further downside to 1.05500 & 1.05240.
Comment: RSI is above 50 levels and Pairs above its 20MA & 55MA.
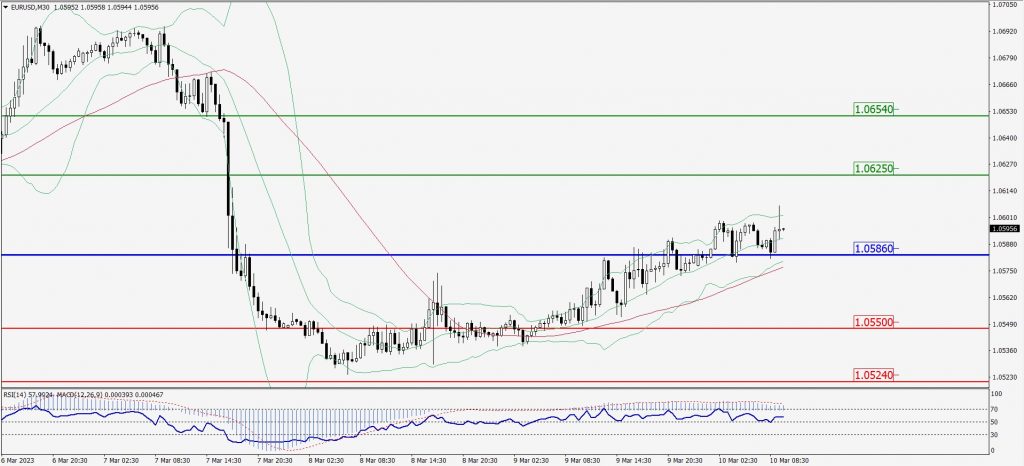
Green Lines Indicate Resistance Levels – Red Lines Indicate Support Levels
Light Blue is a Pivot Point – Black represents the price when the report was produced
GBP/USD Intraday: Major trend on the upside
Our pivot point is at 1.19320
Preferable Price Action: Buy positions above pivot with targets at 1.20040 & 1.20480 in extension.
Alternative Price Action: The price below pivot would call for further downside to 1.18780 & 1.18400.
Comment: RSI is above 50 levels and Pairs above its 20MA & 55MA.
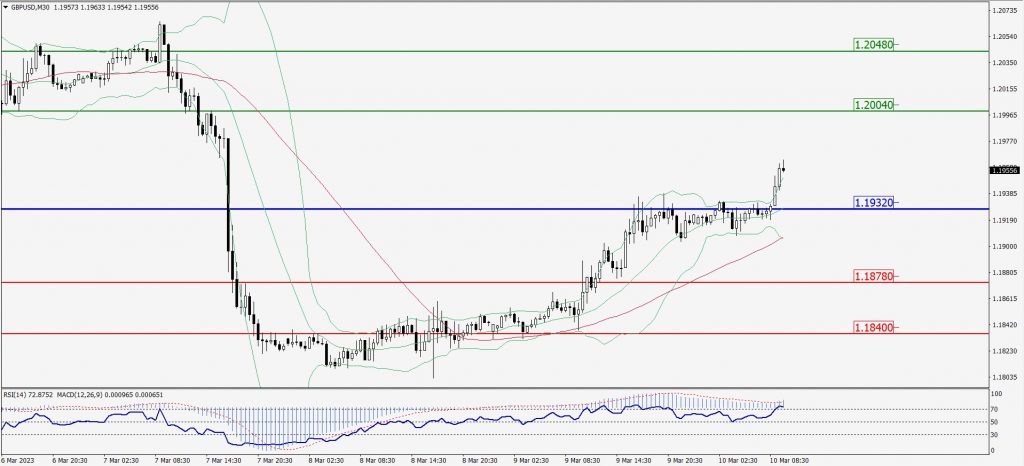
Green Lines Indicate Resistance Levels – Red Lines Indicate Support Levels
Light Blue is a Pivot Point – Black represents the price when the report was produced
USD/JPY Intraday: In a consolidation zone
Our pivot point is at 136.540
Preferable Price Action: Sell position below pivot with the target at 135.970 and 135.600 in extension.
Alternative Price Action: The upside breakout of the pivot would call for 137.070 and 137.480.
Comment: MACD is at 50 level.
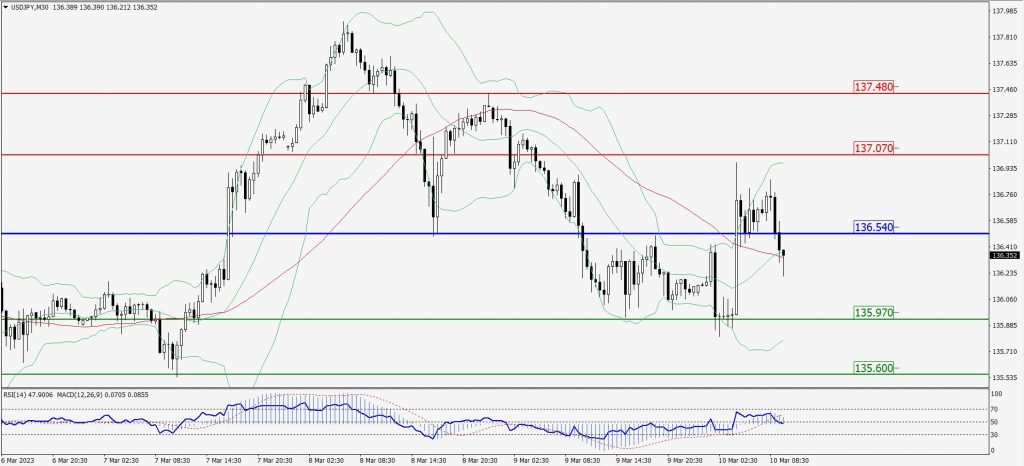
Green Lines Indicate Resistance Levels – Red Lines Indicate Support Levels
Light Blue is a Pivot Point – Black represents the price when the report was produced
AUD/USD Intraday: Major support level at 0.65890
Our pivot point is at 0.65890
Preferable Price Action: Buy positions above pivot with targets at 0.66400 & 0.66760 in extension.
Alternative Price Action: Below pivot looks for a further upside with 0.65470 & 0.65110 as targets.
Comment: RSI is above 50 levels and pairs above 20MA.
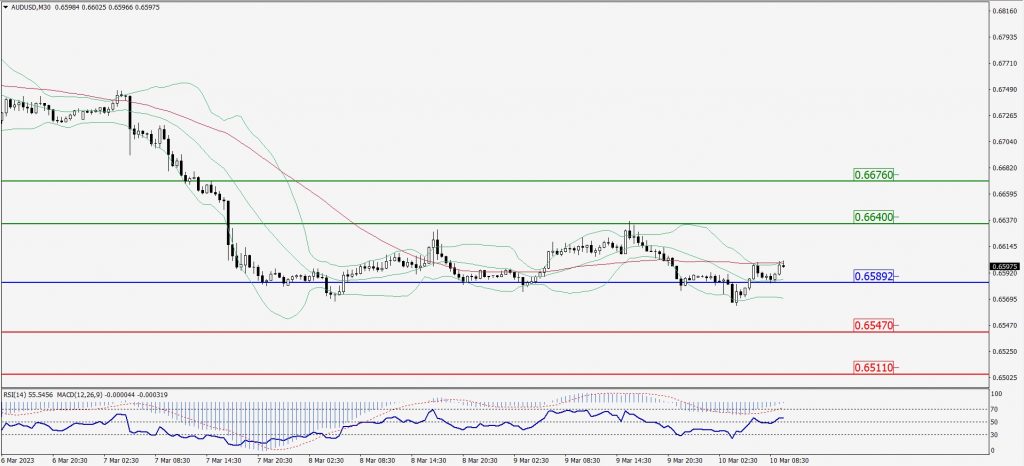
Green Lines Indicate Resistance Levels – Red Lines Indicate Support Levels
Light Blue is a Pivot Point – Black represents the price when the report was produced
CRUDEOIL Intraday: Resistance level at 75.59
Our pivot point is at 75.59
Preferable Price Action: Below pivot sell oil with 74.15 & 73.19 as targets.
Alternative Price Action: Buy crude above pivot with targets at 76.86 and 77.92 in extension.
Comment: MACD is negative territory and Pairs below 55MA.
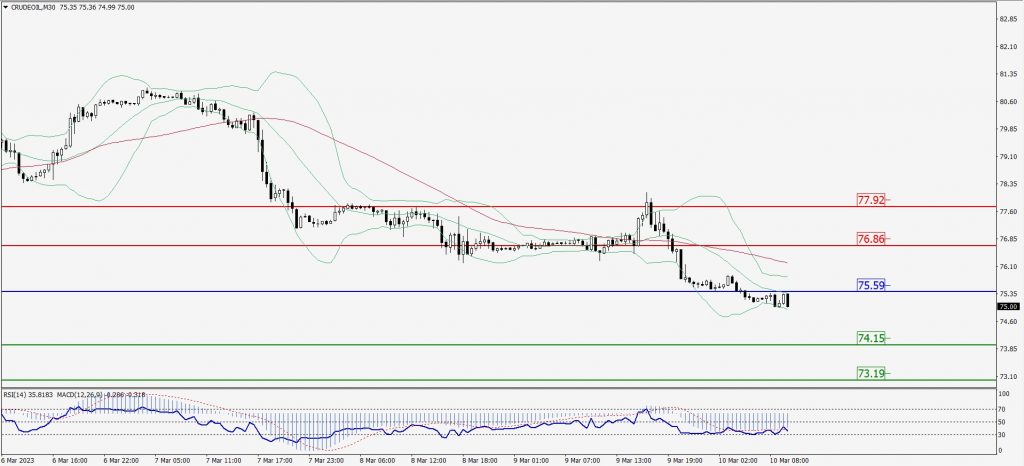
Green Lines Indicate Resistance Levels – Red Lines Indicate Support Levels
Light Blue is a Pivot Point – Black represents the price when the report was produced
XAU/USD Intraday: Trend on the upside
Our pivot point is 1832.40
Preferable Price Action: Further upside to 1840.90 and 1847.40
Alternative Price Action: If the price gives a downside breakout of a pivot, then the price extends to 1824.80 and 1819.00.
Comment: MACD is above 50 level and Pairs above its 20MA & 55MA.
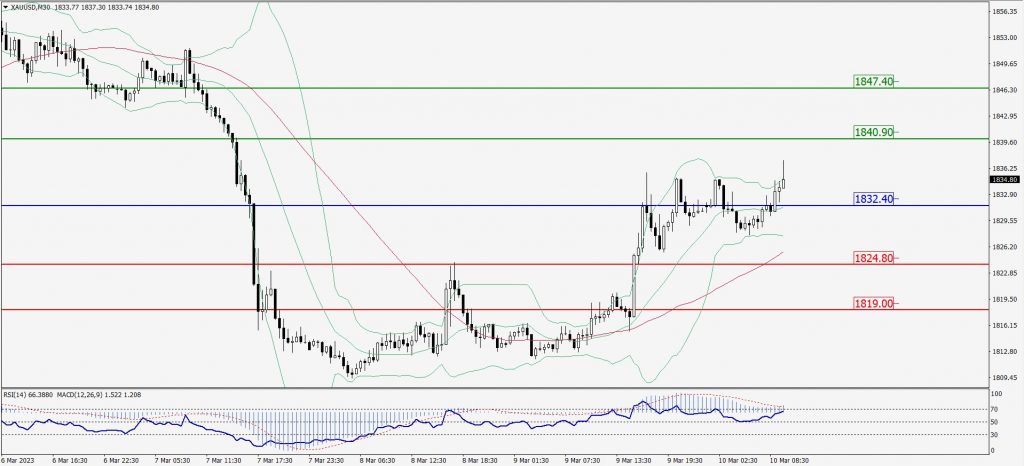
Green Lines Indicate Resistance Levels – Red Lines Indicate Support Levels
Light Blue is a Pivot Point – Black represents the price when the report was produced
Dow Jones Intraday: Major trend on the downside
Our pivot point is 32,201.00
Preferable Price Action: Take sell positions below the pivot with targets at 31,872.00 & 31,635.00.
Alternative Price Action: Above 32,201.00 looks for further downside to 32,495.00 & 32,757.00.
Comment: RSI is below 50 levels and Pairs below its 20MA & 50MA.
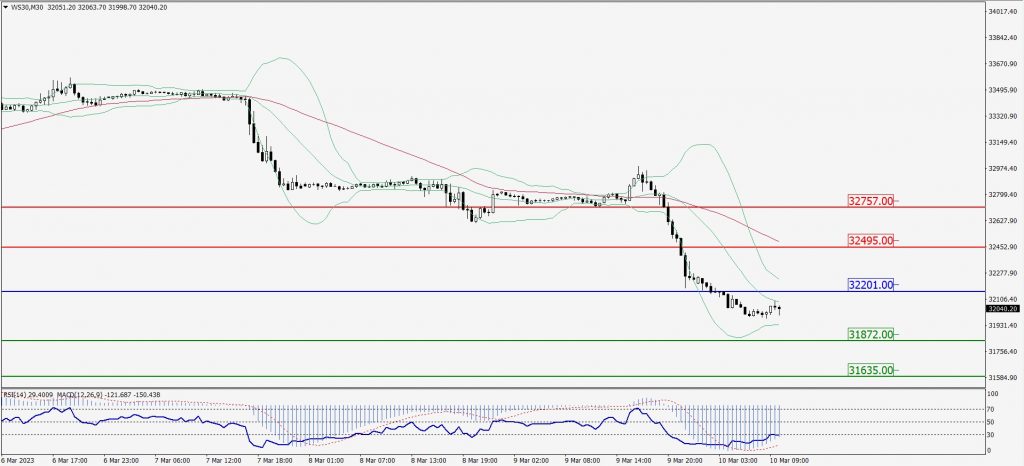
Green Lines Indicate Resistance Levels – Red Lines Indicate Support Levels
Light Blue is a Pivot Point – Black represents the price when the report was produced