Market Wrap: Stocks, Bonds, Commodities
Wall Street stocks advanced Wednesday following a surprisingly benign US inflation report that raised hopes the Federal Reserve will soon end its monetary tightening campaign.
The Dow Jones Industrial Average rose 86.01 points to 34,347.43, the S&P 500 gain 0.74% to 4,472.16 and the Nasdaq Composite add 158.26 points to 13,918.96.
MSCI’s index of Asia-Pacific stocks outside Japan is advance 1.87% to 650.31 levels. The Australian index was higher by 1.56% to 7,246.90. Japanese Nikkei Index advance 1.49% today.
European stocks were positive on Thursday, with the Stoxx Europe 50 Index rose 0.54% to 4,383.95, Germany’s DAX advance 0.43% to 16,092.45, and France’s CAC ascend 0.52% to 7,371.56 and U.K.’s FTSE 100 add 0.18% to 7,429.83.
Benchmark 10-year U.S. Treasury fell as demand for safe assets ascend again, today 10-year bond yields negative 1.14% to 3.8190.
Global oil benchmark Brent hovered above $80 a barrel on Thursday, fuelled by U.S. inflation data that presaged the interest rate hike cycle in the world’s biggest economy is set to finally cool.
Spot Brent crude oil ascend 0.10% to $80.22 per barrel. US West Texas Intermediate crude is up 0.08% to $75.83 a barrel.
The yellow metal gold is advance 0.21% to 1,965.75 dollars per ounce.
Market Wrap: Forex
A bruised dollar was nudged lower still in Asia on Thursday, as traders took surprisingly slow U.S. inflation as a signal U.S. interest rate rises will be all but finished by month’s end.
Today, the U.S. dollar index measures the Greenback against a trade-weighted basket of six major currencies, which slipped 0.19% to 100.000.
The Euro US Dollar (EUR/USD) is a widely traded pair that is up 0.30% today. This left the pair trading around $1.11610.
The Japanese yen was negative against the U.S. dollar on Thursday. Today USD/JPY is slipped 0.09% to the 138.380 level.
Another commodity-related currency positive against the U.S dollar, AUD/USD rose 0.83% to 0.68430, and NZD/USD surged 0.95% to 0.63540 level.
EUR/USD Intraday: Support level at 1.11360
Our pivot point is at 1.11360
Preferable Price Action: Take buy positions above pivot level with targets at 1.12050 & 1.12460 in extension.
Alternative Price Action: Below pivot looks for a further downside to 1.10790 & 1.10380.
Comment: RSI is above 50 levels and Pairs above its 20MA & 55MA.
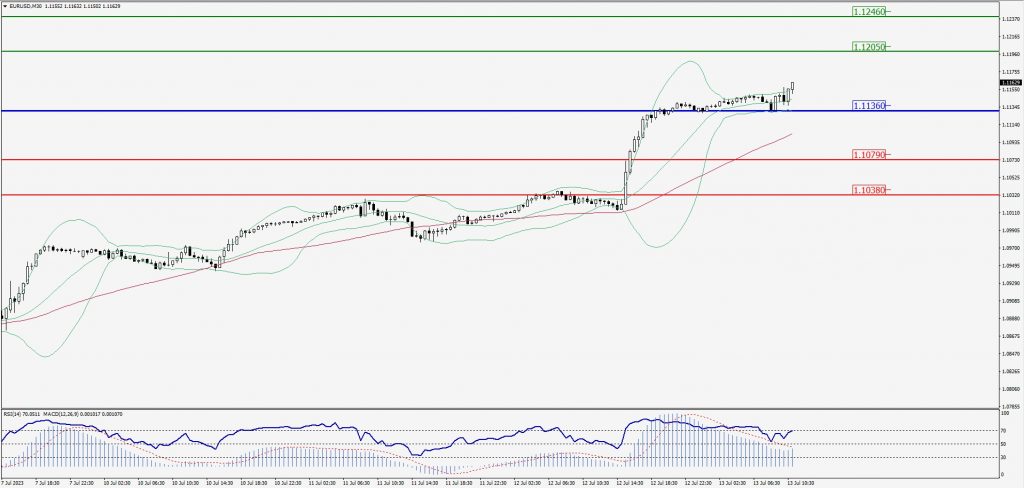
Green Lines Indicate Resistance Levels – Red Lines Indicate Support Levels
Light Blue is a Pivot Point – Black represents the price when the report was produced
GBP/USD Intraday: Major trend on the upside
Our pivot point is at 1.30320
Preferable Price Action: Buy positions above pivot with targets at 1.31090 & 1.31600 in extension.
Alternative Price Action: The price below pivot would call for further downside to 1.29630 & 1.29160.
Comment: RSI is above 50 levels and Pairs above its 20MA & 55MA.
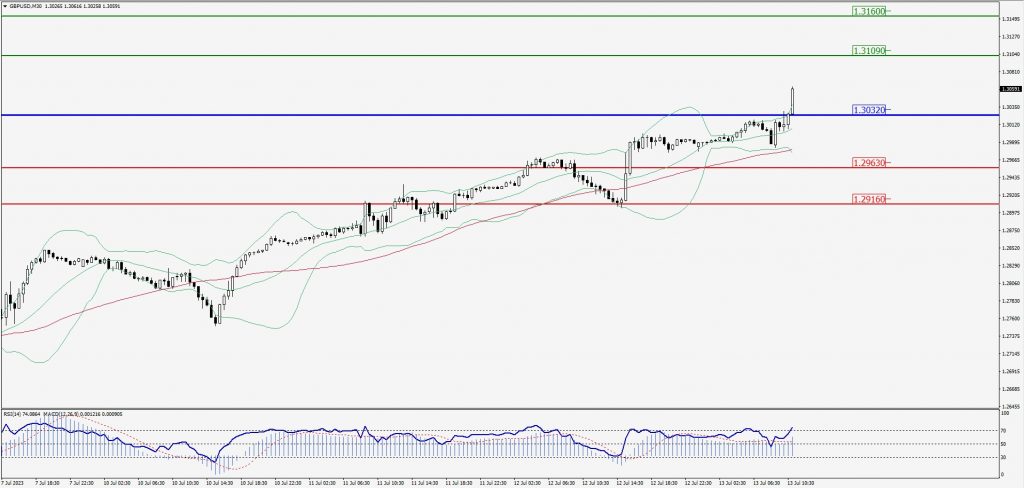
Green Lines Indicate Resistance Levels – Red Lines Indicate Support Levels
Light Blue is a Pivot Point – Black represents the price when the report was produced
USD/JPY Intraday: Resistance level at 138.920
Our pivot point is at 138.920
Preferable Price Action: Sell position below pivot with the target at 137.700 and 136.920 in extension.
Alternative Price Action: The upside breakout of the pivot would call for 140.000 and 140.840.
Comment: MACD is below 50 level and Pairs below its 20MA & 55MA.
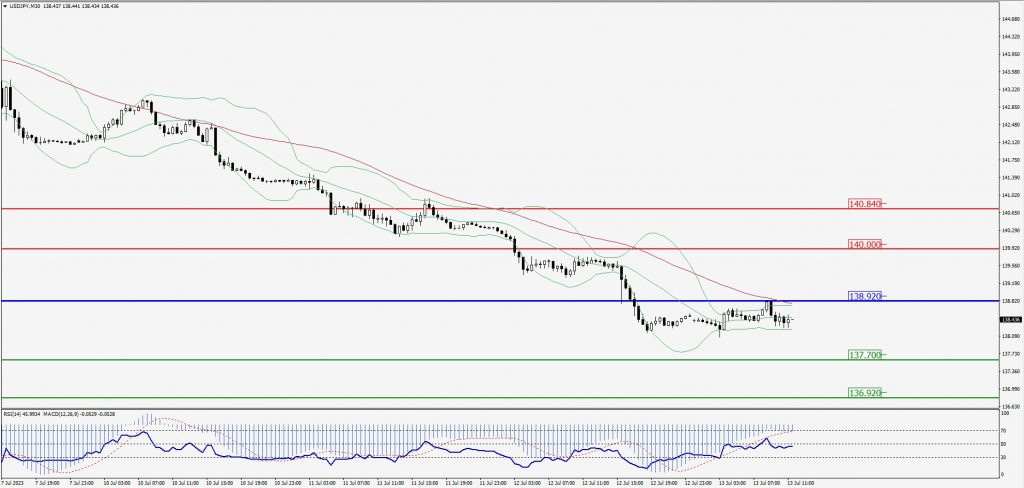
Green Lines Indicate Resistance Levels – Red Lines Indicate Support Levels
Light Blue is a Pivot Point – Black represents the price when the report was produced
AUD/USD Intraday: Major trend on the upside
Our pivot point is at 0.68330
Preferable Price Action: Buy positions above pivot with targets at 0.68760 & 0.69070 in extension.
Alternative Price Action: Below pivot looks for a further downside with 0.67930 & 0.67600 as targets.
Comment: RSI is above 50 levels and Pairs above its 20MA & 55MA.
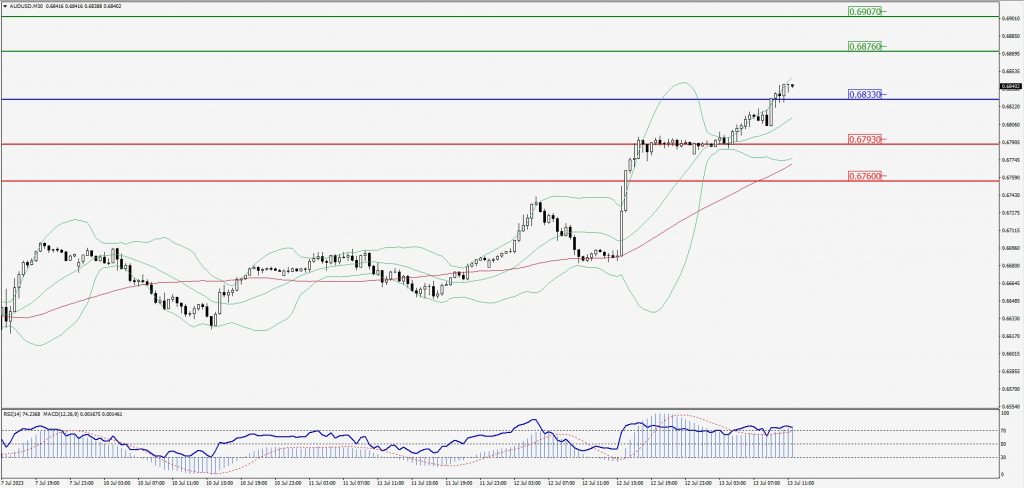
Green Lines Indicate Resistance Levels – Red Lines Indicate Support Levels
Light Blue is a Pivot Point – Black represents the price when the report was produced
CRUDEOIL Intraday: Trend on the upside
Our pivot point is at 75.58
Preferable Price Action: Above pivot buy oil with 76.57 & 77.17 as targets.
Alternative Price Action: Sell crude below pivot with targets at 74.77 and 74.18 in extension.
Comment: MACD is positive territory and Pairs above its 20MA & 55MA.
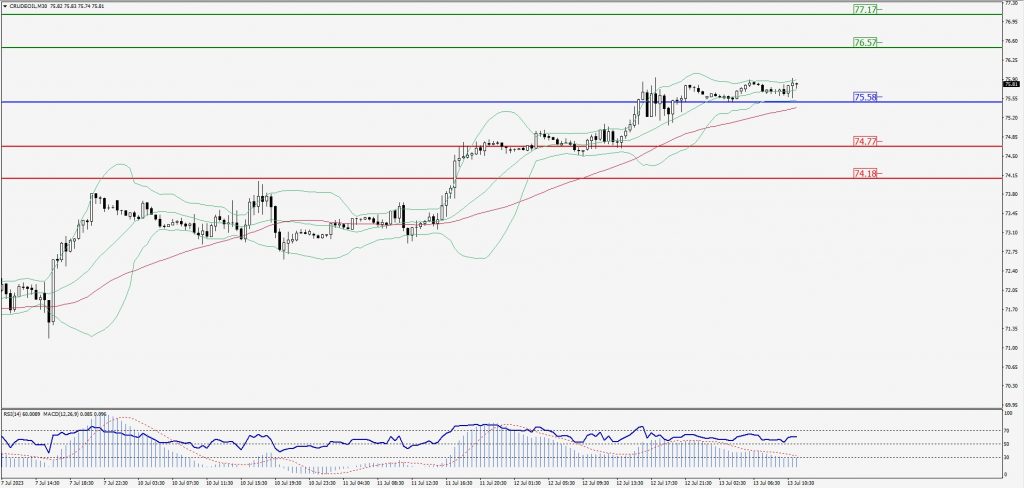
Green Lines Indicate Resistance Levels – Red Lines Indicate Support Levels
Light Blue is a Pivot Point – Black represents the price when the report was produced
XAU/USD Intraday: Trend on the upside
Our pivot point is 1957.30
Preferable Price Action: Further upside to 1967.90 and 1974.00.
Alternative Price Action: If the price gives a downside breakout of a pivot, then the price extends to 1948.80 and 1942.60.
Comment: MACD is above 50 level and Pairs above its 20MA & 55MA.
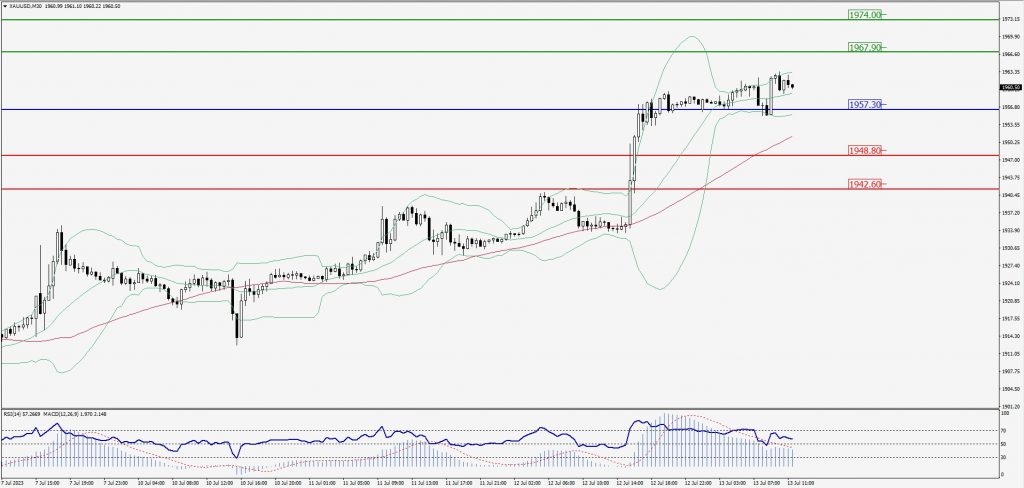
Green Lines Indicate Resistance Levels – Red Lines Indicate Support Levels
Light Blue is a Pivot Point – Black represents the price when the report was produced
Dow Jones Intraday: Trend on the upside
Our pivot point is 34,363.00
Preferable Price Action: Take buy positions above the pivot with targets at 34,511.00 & 34,621.00.
Alternative Price Action: Below 34,363.00 looks for further downside to 34,230.00 & 34,142.00.
Comment: RSI is above 50 levels and Pairs above its 20MA & 55MA.
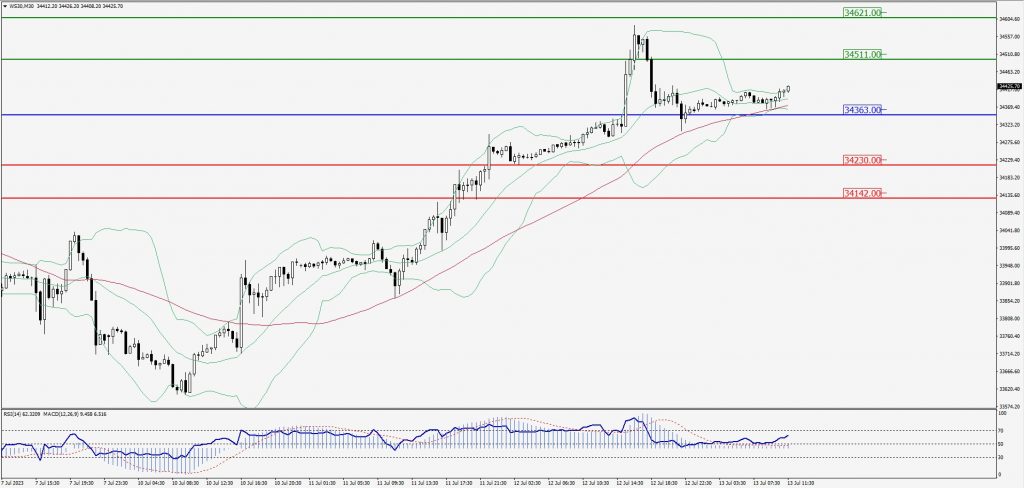
Green Lines Indicate Resistance Levels – Red Lines Indicate Support Levels
Light Blue is a Pivot Point – Black represents the price when the report was produced