Market Wrap: Stocks, Bonds, Commodities
The Nasdaq ended lower on Friday as megacap growth stocks came under pressure after Treasury yields pointed to higher interest rates and shares of ride-hailing firm Lyft plunged following a downbeat profit forecast.
The Dow Jones Industrial Average rose 169.39 points to 33,869.27, the S&P 500 gain 0.22% to 4,090.46 and the Nasdaq Composite subtract 71.46 points to 11,718.12.
MSCI’s index of Asia-Pacific stocks outside Japan is drop 0.43% to 658.74 levels. The Australian index was lower by 0.21% to 7,417.80. Japanese Nikkei Index fell 0.88% today.
European stocks were positive on Monday, with the Stoxx Europe 50 Index gain 0.26% to 4,208.65, Germany’s DAX rose 0.05% to 15,315.35, and France’s CAC ascend 0.22% to 7,145.26, and U.K.’s FTSE 100 add 0.14% to 7,893.60.
Benchmark 10-year U.S. Treasury fell as demand for safe assets ascend again, today 10-year bond yields are negative 0.09% to 3.7400.
Oil prices eased on Monday after rising 2% in the previous session as investors shrugged off the impact of Russian output cuts, instead focusing on short-term demand concerns stemming from refinery maintenance in Asia and the United States.
Spot Brent crude oil fell 0.85% to $85.66 per barrel. US West Texas Intermediate crude is down 0.97% to $78.95 a barrel.
The yellow metal gold is decline 0.01% to 1,874.25 dollars per ounce.
Market Wrap: Forex
The U.S. dollar edged higher in early European trade Monday, trading close to a five-week high ahead of the week’s keenly-awaited U.S. inflation data, which could provide more clarity about the Federal Reserve’s rate hike path.
Today, the U.S. dollar index measures the Greenback against a trade-weighted basket of six major currencies, which surge 0.01% to 103.547.
The Euro US Dollar (EUR/USD) is a widely traded pair that is up 0.07% today. This left the pair trading around $1.06820.
The Japanese yen was positive against the U.S. dollar on Monday. Today USD/JPY is advance 0.60% to the 132.200 level.
Another commodity-related currency positive against the U.S dollar, AUD/USD gain 0.09% to 0.69220, and NZD/USD rose 0.41% to 0.63260 level.
EUR/USD Intraday: Support level at 1.06750
Our pivot point is at 1.06750
Preferable Price Action: Take long positions above pivot level with targets at 1.07180 & 1.07480 in extension.
Alternative Price Action: Below pivot looks for a further downside to 1.06320 & 1.06030.
Comment: RSI is above 50 levels and Pairs above 20MA.
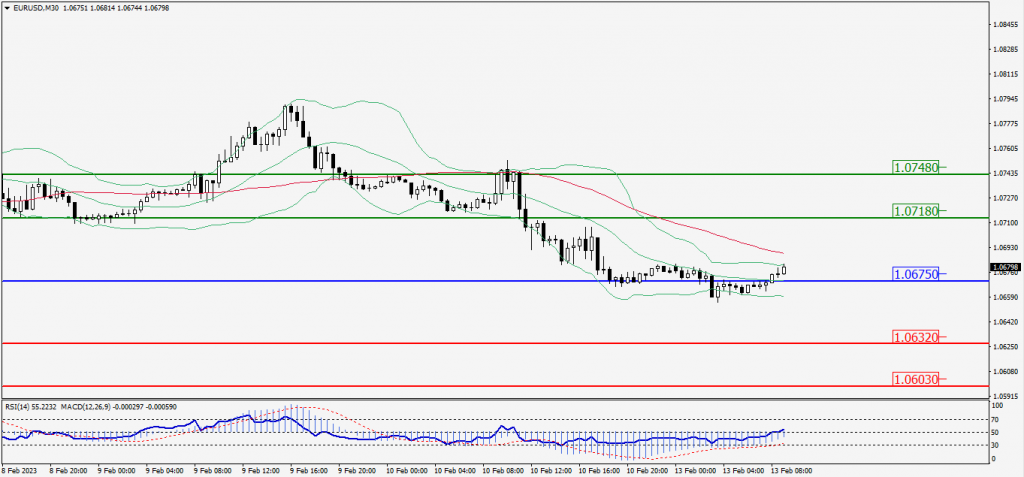
Green Lines Indicate Resistance Levels – Red Lines Indicate Support Levels
Light Blue is a Pivot Point – Black represents the price when the report was produced
GBP/USD Intraday: In a consolidation zone
Our pivot point is at 1.20690
Preferable Price Action: Sell positions below pivot with targets at 1.20220 & 1.19960 in extension.
Alternative Price Action: The price above pivot would call for further upside to 1.21190 & 1.21450.
Comment: RSI is below 50 levels and Pairs below 55MA.
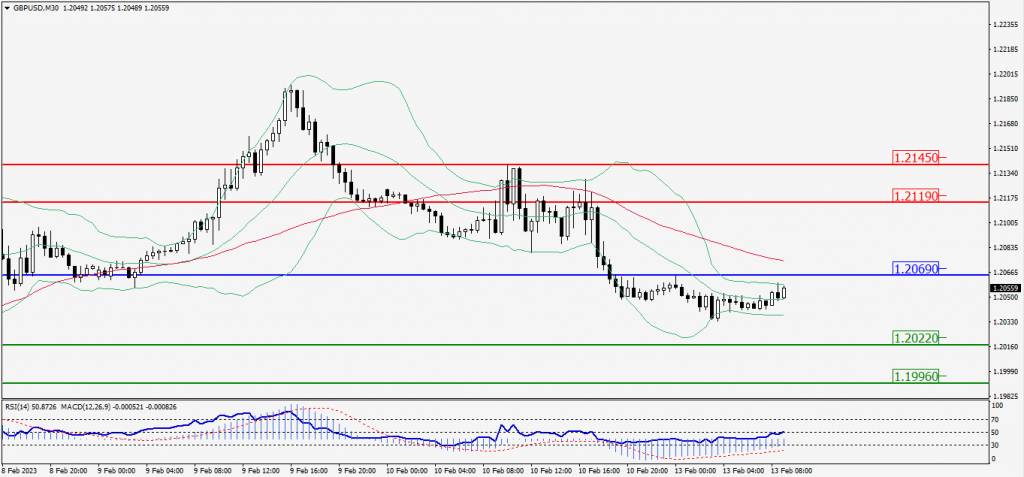
Green Lines Indicate Resistance Levels – Red Lines Indicate Support Levels
Light Blue is a Pivot Point – Black represents the price when the report was produced
USD/JPY Intraday: Major trend on the upside
Our pivot point is at 132.150
Preferable Price Action: Buy position above pivot with the target at 132.980 and 133.450 in extension.
Alternative Price Action: The downside breakout of the pivot would call for 131.330 and 130.860.
Comment: MACD is above 50 level and Pairs above its 20MA & 55MA.
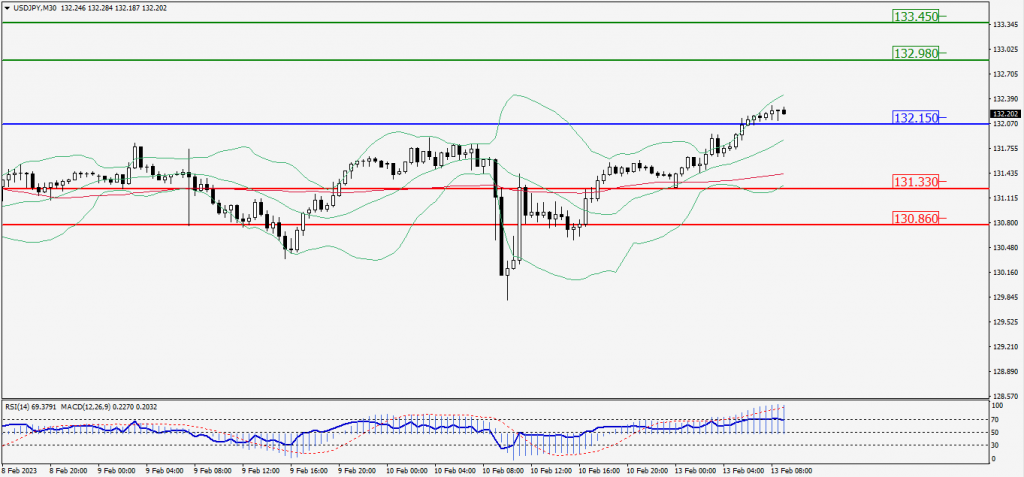
Green Lines Indicate Resistance Levels – Red Lines Indicate Support Levels
Light Blue is a Pivot Point – Black represents the price when the report was produced
AUD/USD Intraday: Trend on the upside
Our pivot point is at 0.69160
Preferable Price Action: Buy positions above pivot with targets at 0.69500 & 0.69690 in extension.
Alternative Price Action: Below pivot looks for a further downside with 0.68830 & 0.68660 as targets.
Comment: RSI is above 50 levels and pairs above 20MA.
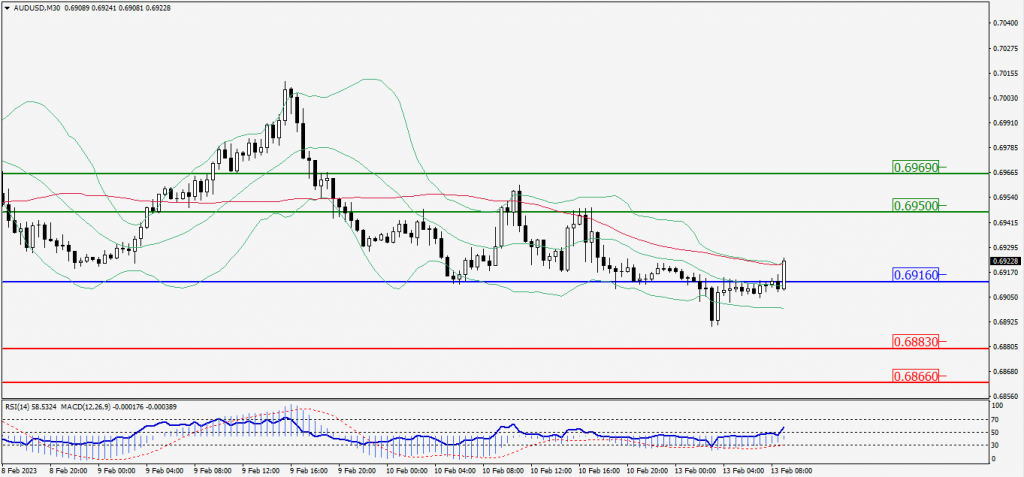
Green Lines Indicate Resistance Levels – Red Lines Indicate Support Levels
Light Blue is a Pivot Point – Black represents the price when the report was produced
CRUDEOIL Intraday: Trend on the downside
Our pivot point is at 79.35
Preferable Price Action: Below pivot sell oil with 78.66 & 78.27 as targets.
Alternative Price Action: Buy crude above pivot with targets at 80.05 and 80.43 in extension.
Comment: MACD is negative territory and Pairs below its 20MA & 55MA.
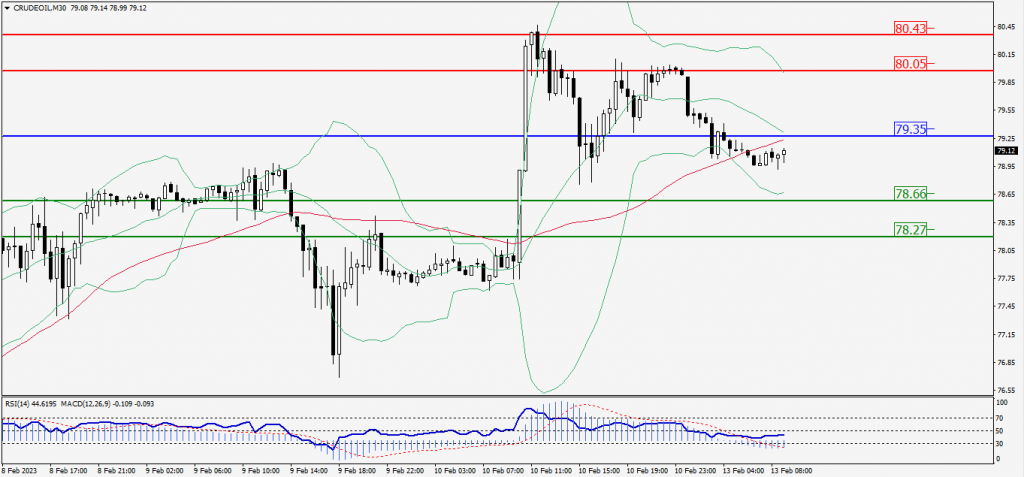
Green Lines Indicate Resistance Levels – Red Lines Indicate Support Levels
Light Blue is a Pivot Point – Black represents the price when the report was produced
XAU/USD Intraday: Support level at 1863.10
Our pivot point is 1863.10
Preferable Price Action: Further upside to 1871.60 and 1876.60
Alternative Price Action: If the price gives a downside breakout of a pivot, then the price extends to 1855.10 and 1849.80.
Comment: MACD is above 50 level and Pairs above its 20MA & 55MA.
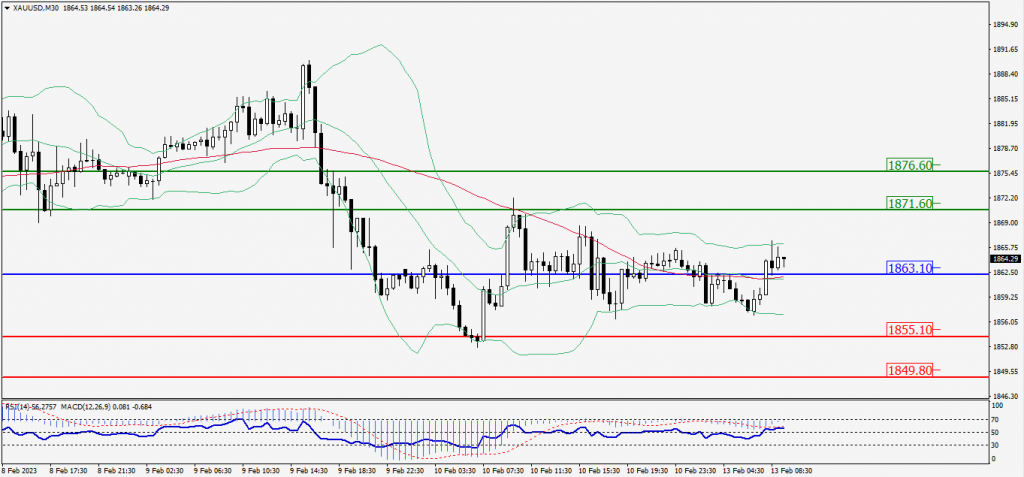
Green Lines Indicate Resistance Levels – Red Lines Indicate Support Levels
Light Blue is a Pivot Point – Black represents the price when the report was produced
Dow Jones Intraday: Trend on the upside
Our pivot point is 33,775.00
Preferable Price Action: Take buy positions above the pivot with targets at 33,913.00 & 33,992.00.
Alternative Price Action: Below 33,775.00 looks for further downside to 33,645.00 & 33,569.00.
Comment: RSI is above 50 levels and Pairs above 55MA.
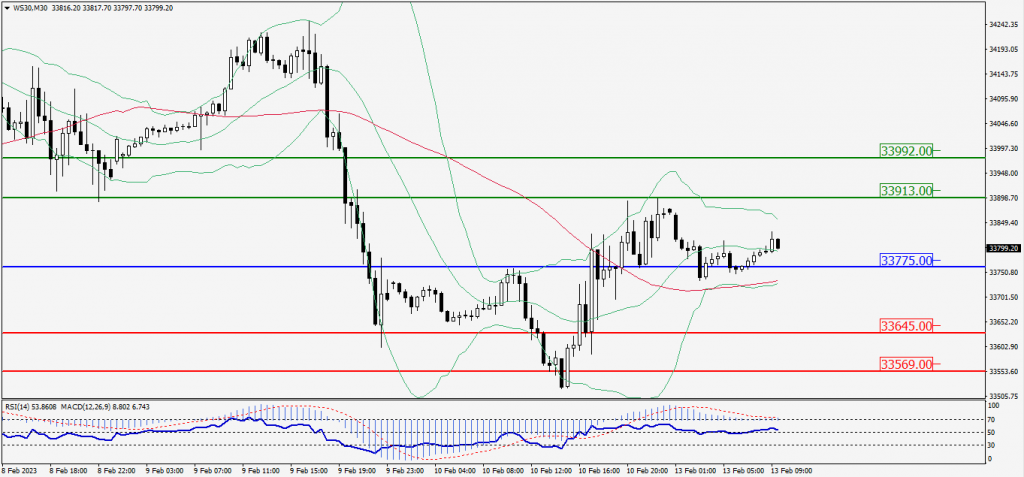
Green Lines Indicate Resistance Levels – Red Lines Indicate Support Levels
Light Blue is a Pivot Point – Black represents the price when the report was produced