Market Wrap: Stocks, Bonds, Commodities
US stock indexes ended lower on Thursday, erasing earlier gains as Treasury yields rose after an auction of 30-year bonds went poorly and overshadowed strong earnings from corporate giants like Disney and PepsiCo.
The Dow Jones Industrial Average fell 249.13 points to 33,699.88, the S&P 500 lose 0.88% to 4,081.50 and the Nasdaq Composite subtract 120.94 points to 11,789.58.
MSCI’s index of Asia-Pacific stocks outside Japan is drop 1.06% to 662.51 levels. The Australian index was lower by 0.76% to 7,433.70. Japanese Nikkei Index rose 0.31% today.
European stocks were negative on Friday, with the Stoxx Europe 50 Index lose 0.50% to 4,229.95, Germany’s DAX fell 0.33% to 15,478.65, and France’s CAC drop 0.27% to 7,166.44, and U.K.’s FTSE 100 subtract 0.39% to 7,880.30.
Benchmark 10-year U.S. Treasury fell as demand for safe assets ascend again, today 10-year bond yields are negative 0.37% to 3.6690.
Crude prices eased on Thursday as oil infrastructure appeared to have escaped serious damage from the earthquake that devastated parts of Turkey and Syria, while US inventories swelled and investors worried about Federal Reserve rate hikes.
Spot Brent crude oil fell 0.43% to $84.15 per barrel. US West Texas Intermediate crude is down 0.59% to $77.61 a barrel.
The yellow metal gold is advance 0.11% to 1,880.35 dollars per ounce.
Market Wrap: Forex
The U.S. dollar edged higher in early European trade Friday, on course to post another positive week, amid caution ahead of next week’s crucial inflation data release.
Today, the U.S. dollar index measures the Greenback against a trade-weighted basket of six major currencies, which slipped 0.15% to 102.942.
The Euro US Dollar (EUR/USD) is a widely traded pair that is up 0.02% today. This left the pair trading around $1.07370.
The Japanese yen was negative against the U.S. dollar on Friday. Today USD/JPY is decline 1.05% to the 130.180 level.
Another commodity-related currency positive against the U.S dollar, AUD/USD gain 0.16% to 0.69460, and NZD/USD rose 0.18% to 0.63340 level.
EUR/USD Intraday: Support level at 1.07300
Our pivot point is at 1.07300
Preferable Price Action: Take long positions above pivot level with targets at 1.07750 & 1.08100 in extension.
Alternative Price Action: Below pivot looks for a further downside to 1.06920 & 1.06640.
Comment: RSI is at 50 levels.
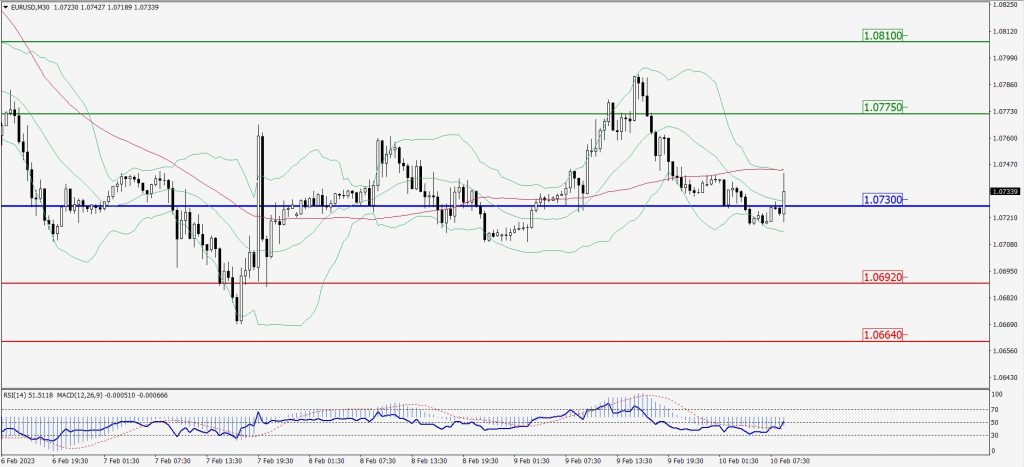
Green Lines Indicate Resistance Levels – Red Lines Indicate Support Levels
Light Blue is a Pivot Point – Black represents the price when the report was produced
GBP/USD Intraday: Trend on the downside
Our pivot point is at 1.21220
Preferable Price Action: Sell positions below pivot with targets at 1.20740 & 1.20440 in extension.
Alternative Price Action: The price above pivot would call for further upside to 1.21590 & 1.21900.
Comment: RSI is below 50 levels and Pairs below its 20MA & 55MA.
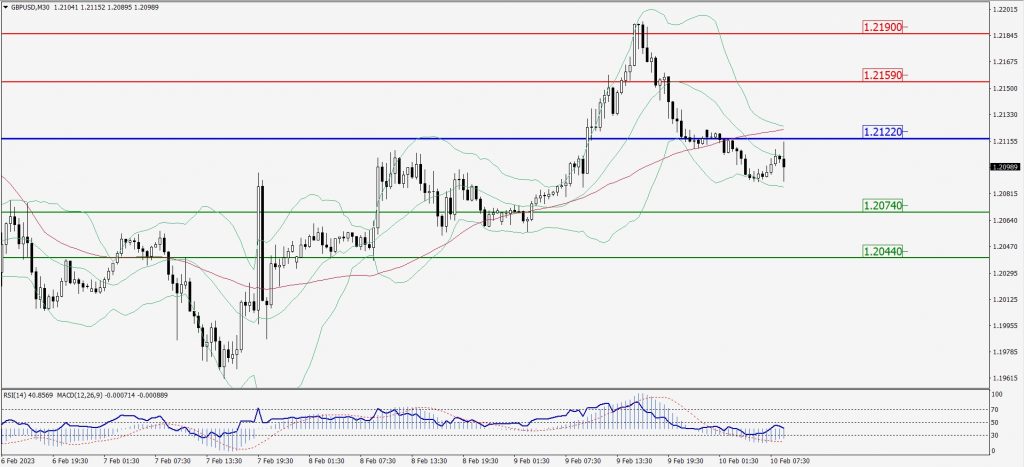
Green Lines Indicate Resistance Levels – Red Lines Indicate Support Levels
Light Blue is a Pivot Point – Black represents the price when the report was produced
USD/JPY Intraday: Major trend on the downside
Our pivot point is at 131.170
Preferable Price Action: Sell position below pivot with the target at 130.380 and 129.810 in extension.
Alternative Price Action: The upside breakout of the pivot would call for 131.880 and 132.510.
Comment: MACD is below 50 level and Pairs below its 20MA & 55MA.
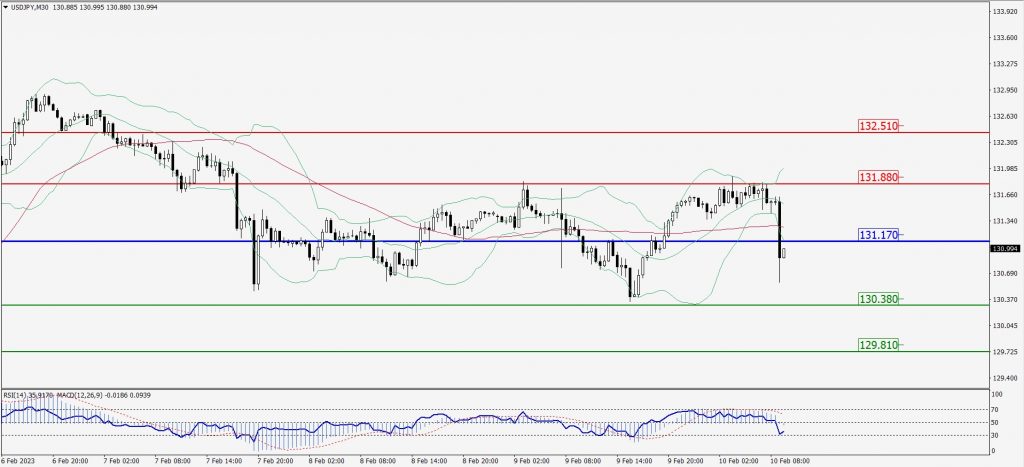
Green Lines Indicate Resistance Levels – Red Lines Indicate Support Levels
Light Blue is a Pivot Point – Black represents the price when the report was produced
AUD/USD Intraday: In a consolidation zone
Our pivot point is at 0.69470
Preferable Price Action: Sell positions below pivot with targets at 0.69000 & 0.68650 in extension.
Alternative Price Action: Above pivot looks for a further upside with 0.69890 & 0.70240 as targets.
Comment: RSI is at 50 levels and pairs below 55MA.
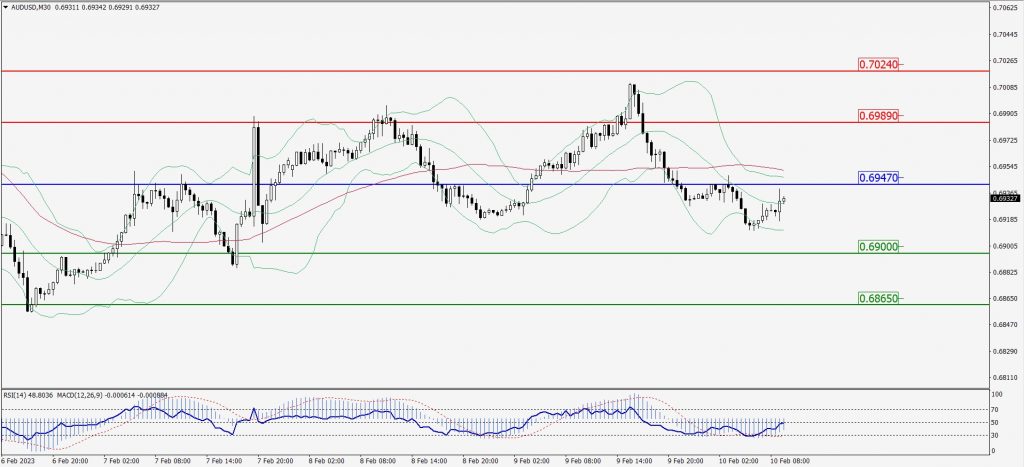
Green Lines Indicate Resistance Levels – Red Lines Indicate Support Levels
Light Blue is a Pivot Point – Black represents the price when the report was produced
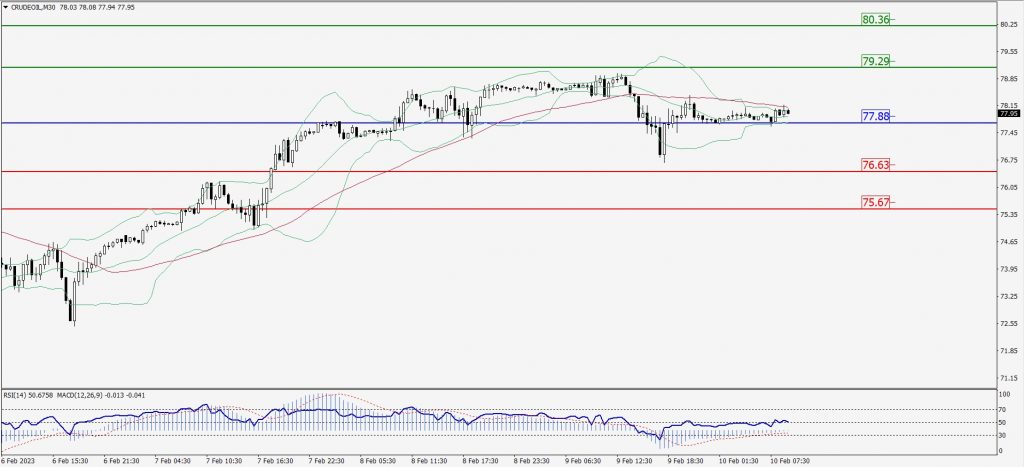
CRUDEOIL Intraday: Support level at 77.88
Our pivot point is at 77.88
Preferable Price Action: Above pivot buy oil with 79.29 & 80.36 as targets.
Alternative Price Action: Sell crude below pivot with targets at 76.63 and 75.67 in extension.
Comment: MACD is at territory.
 0
0
Green Lines Indicate Resistance Levels – Red Lines Indicate Support Levels
Light Blue is a Pivot Point – Black represents the price when the report was produced
XAU/USD Intraday: Trend on the downside
Our pivot point is 1864.90
Preferable Price Action: Further downside to 1857.30 and 1851.40
Alternative Price Action: If the price gives an upside breakout of a pivot, then the price extends to 1872.10 and 1877.70.
Comment: MACD is below 50 level and Pairs below 55MA.
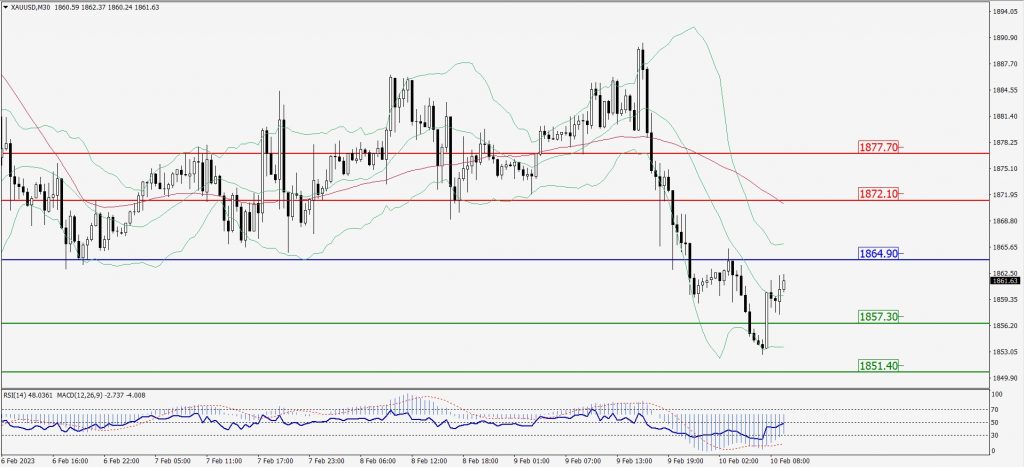
Green Lines Indicate Resistance Levels – Red Lines Indicate Support Levels
Light Blue is a Pivot Point – Black represents the price when the report was produced
Dow Jones Intraday: Trend on the downside
Our pivot point is 33,752.00
Preferable Price Action: Take sell positions below the pivot with targets at 33,629.00 & 33,546.00.
Alternative Price Action: Above 33,752.00 looks for further upside to 33,858.00 & 33,945.00.
Comment: RSI is below 50 levels and Pairs below 55MA.
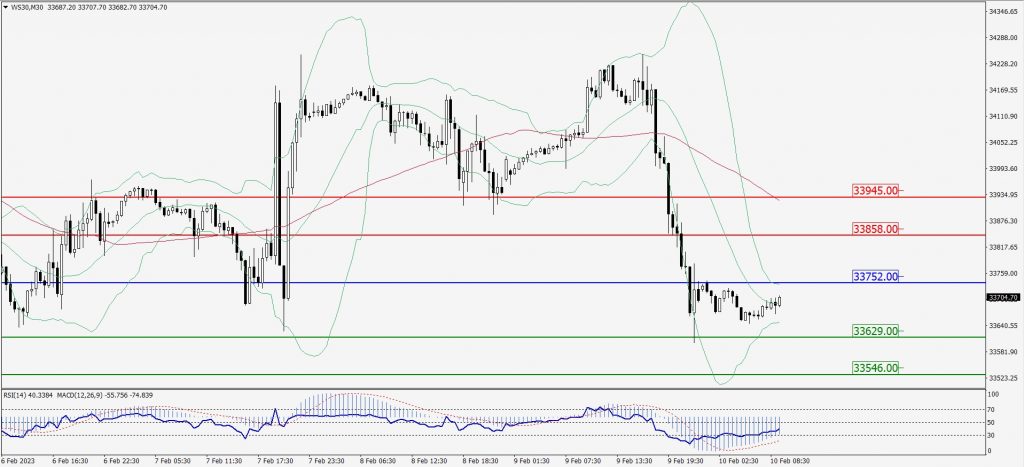
Green Lines Indicate Resistance Levels – Red Lines Indicate Support Levels
Light Blue is a Pivot Point – Black represents the price when the report was produced