Market Wrap: Stocks, Bonds, Commodities
All three major US stock indexes closed higher on Wednesday with a boost from the technology sector offsetting investor disappointment at an early morning inflation report, which crushed hopes the Federal Reserve would cut interest rates by 50 basis points next week.
The Dow Jones Industrial Average rose 124.75 points to 40,861.71, the S&P 500 gain 1.07% to 5,554.13 and the Nasdaq Composite ascend 369.65 points to 17,395.53.
MSCI’s index of Asia-Pacific stocks outside Japan is up 0.09% to 687.88 levels. The Australian index was higher by 1.10% to 8,075.70. Japanese Nikkei Index increase 3.35% today.
European stocks were positive on Thursday, with the Stoxx Europe 50 Index increase 1.44% to 4,831.95 Germany’s DAX ascend 1.28% to 18,562.85, and France’s CAC higher 1.09% to 7,477.57 and U.K.’s FTSE 100 gain 1.11% to 8,248.65.
Benchmark 10-year U.S. Treasury rose as demand for safe assets slipped again, today 10-year bond yields 0.69% to 3.6760.
Oil prices were trading higher on Thursday despite concerns about lower demand erased the gains from the previous session spurred by Hurricane Francine’s impact on output in the U.S., the world’s biggest crude producer.
Spot Brent crude oil increase 1.57% to $71.72 per barrel. US West Texas Intermediate crude is increase 1.52% to $68.33 a barrel.
The yellow metal gold is up 0.01% to 2,542.55 dollars per ounce.
Market Wrap: Forex
The dollar traded near a four-week high versus the euro on Thursday after signs of some stickiness in U.S. inflation reinforced expectations that the Federal Reserve would avoid a super-sized interest rate cut next week.
Today, the U.S. dollar index measures the Greenback against a trade-weighted basket of six major currencies, which increase 0.13% to 101.82.
The Euro US Dollar (EUR/USD) is a widely traded is down 0.01% today. This left the pair trading around $1.10100.
The Japanese yen was will move positive against the U.S. dollar on Thursday. Today USD/JPY is trades pair that increase 0.46% to the 143.000 level.
Another commodity-related currency positive against the U.S dollar, AUD/USD gain 0.22% to 0.66860, and NZD/USD increase 0.12% to 0.61430 level.
EUR/USD Intraday: Trend on the downside
Our pivot point is at 1.10220
Preferable Price Action: Take sell positions below pivot level with targets at 1.09960 & 1.09730 in extension.
Alternative Price Action: Buy pivot looks for a further upside to 1.10460 & 1.10680.
Comment: RSI is below 50 levels and Pairs below its 55MA.
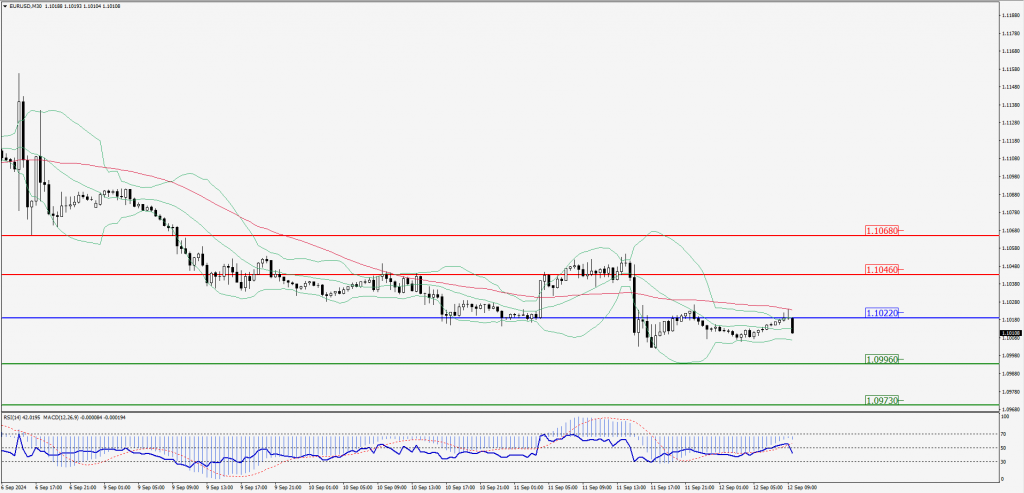
Green Lines Indicate Resistance Levels – Red Lines Indicate Support Levels
Light Blue is a Pivot Point – Black represents the price when the report was produced
GBP/USD Intraday: Trend on the upside
Our pivot point is at 1.30480
Preferable Price Action: Buy positions above pivot with targets at 1.30760 & 1.30970 in extension.
Alternative Price Action: The price below pivot would call for further downside to 1.30210 & 1.29990.
Comment: RSI is above 50 levels and Pairs above its 20MA.
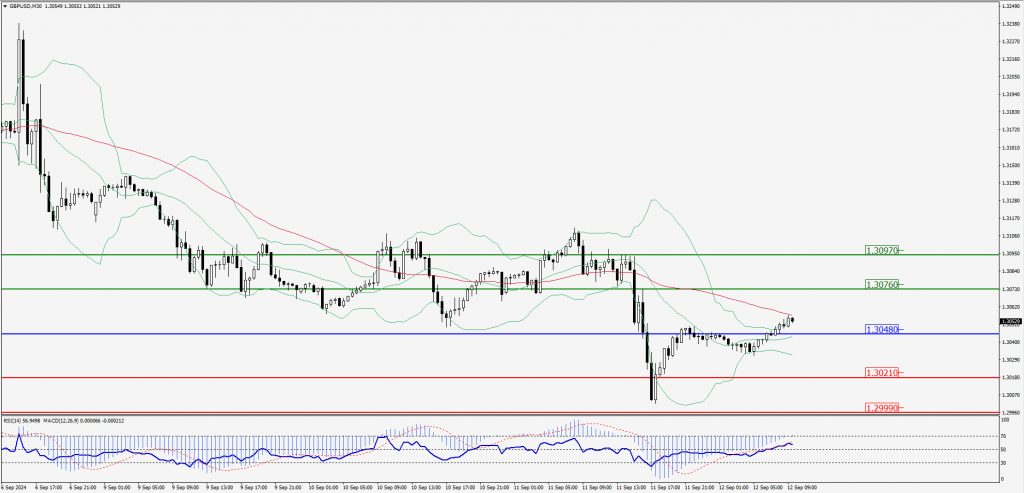
Green Lines Indicate Resistance Levels – Red Lines Indicate Support Levels
Light Blue is a Pivot Point – Black represents the price when the report was produced
USD/JPY Intraday: Trend on the upside
Our pivot point is at 142.440
Preferable Price Action: Buy position above pivot with the target at 142.850 and 143.250 in extension.
Alternative Price Action: The downside breakout of the pivot would call for 142.050 and 141.630.
Comment: MACD is above 50 levels and Pairs above its 55MA.
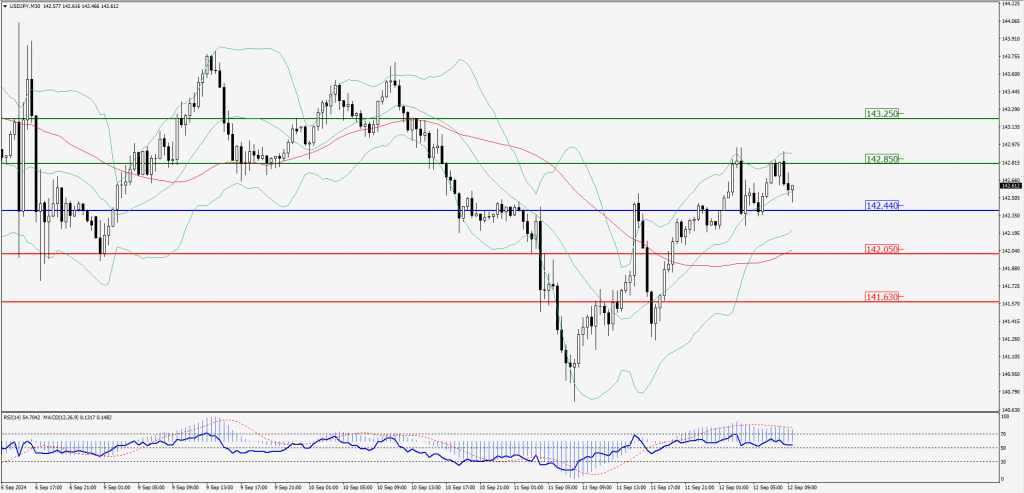
Green Lines Indicate Resistance Levels – Red Lines Indicate Support Levels
Light Blue is a Pivot Point – Black represents the price when the report was produced
AUD/USD Intraday: Trend on the upside
Our pivot point is at 0.66840
Preferable Price Action: Buy positions above pivot with targets at 0.67020 & 0.67200 in extension.
Alternative Price Action: Below pivot a further downside with 0.66680 & 0.66500 as targets.
Comment: RSI is above 50 levels and pairs above its 20MA & 55MA.
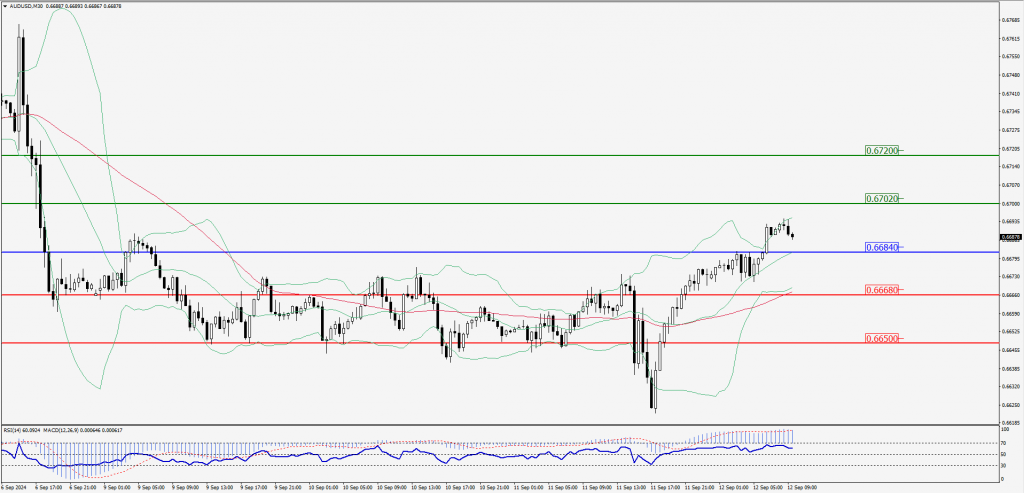
Green Lines Indicate Resistance Levels – Red Lines Indicate Support Levels
Light Blue is a Pivot Point – Black represents the price when the report was produced
CRUDEOIL Intraday: Trend on the upside
Our pivot point is at 67.53
Preferable Price Action: Above pivot buy oil with 68.05 & 68.59 as targets.
Alternative Price Action: Sell crude below pivot with targets at 66.96 and 66.44 in extension.
Comment: RSI is at above 50 levels and pairs above its 20MA & 55MA.
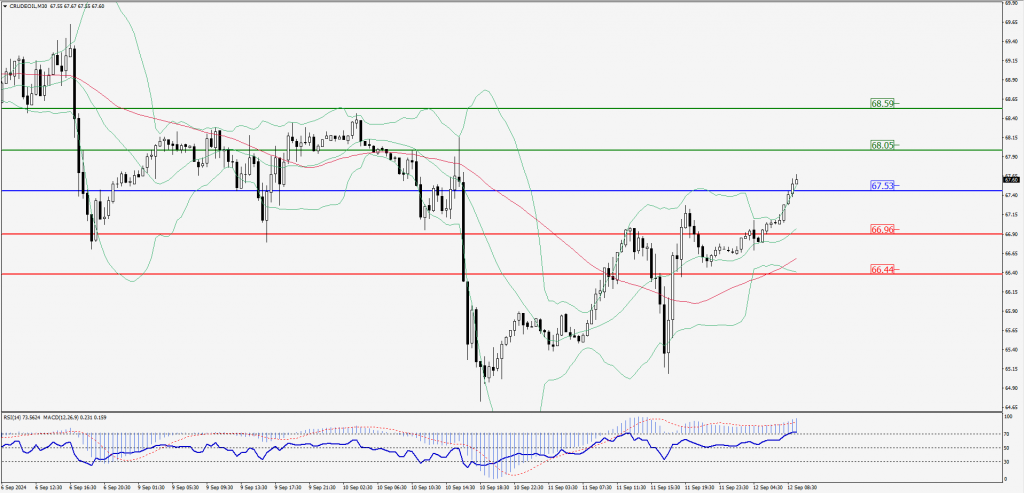
Green Lines Indicate Resistance Levels – Red Lines Indicate Support Levels
Light Blue is a Pivot Point – Black represents the price when the report was produced
XAU/USD Intraday: Trend on the upside
Our pivot point is at 2516.40
Preferable Price Action: Further upside to 2521.30 and 2525.40.
Alternative Price Action: If the price gives an downside breakout of a pivot, then the price extends to 2511.30 and 2506.90.
Comment: MACD is above 50 levels and pairs above its 20MA.
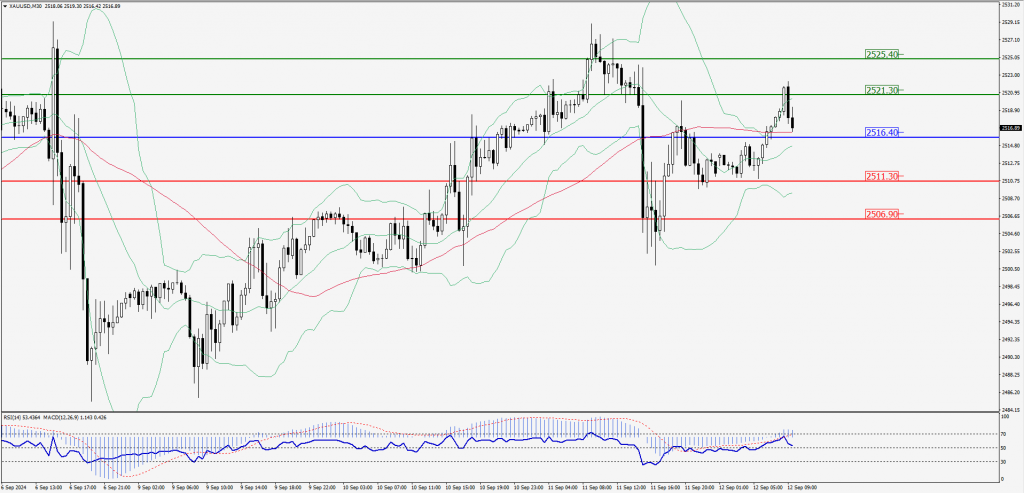
Green Lines Indicate Resistance Levels – Red Lines Indicate Support Levels
Light Blue is a Pivot Point – Black represents the price when the report was produced
Dow Jones Intraday: Trend on the upside
Our pivot point is 40,876.70
Preferable Price Action: Take buy positions above the pivot with targets at 41,013.00 & 41,142.30.
Alternative Price Action: Below 40,876.70 looks for further downside to 40,742.20 & 40,604.20.
Comment: RSI is above 50 levels and pairs above its 55MA & 20MA.
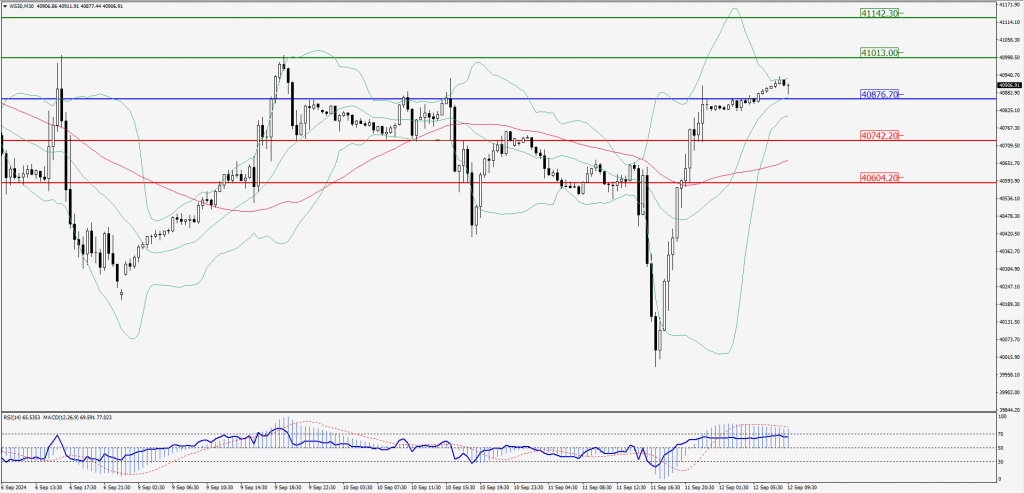
Green Lines Indicate Resistance Levels – Red Lines Indicate Support Levels
Light Blue is a Pivot Point – Black represents the price when the report was produced