Market Wrap: Stocks, Bonds, Commodities
Most Asian currencies gained ground on Wednesday as the dollar retreated in the wake of a fiery U.S. presidential debate, with focus turning to key upcoming inflation data due later in the day.
The Dow Jones Industrial Average fail 92.63 points to 40,736.96, the S&P 500 gain 0.45% to 5,495.50 and the Nasdaq Composite ascend 141.28 points to 17,025.88.
MSCI’s index of Asia-Pacific stocks outside Japan is down 0.18% to 679.18 levels. The Australian index was lower by 0.30% to 7,987.90. Japanese Nikkei Index decrease 1.63% today.
European stocks were mixed on Wednesday, with the Stoxx Europe 50 Index increase 0.60% to 4,775.45 Germany’s DAX ascend 0.38% to 18,348.75, and France’s CAC higher 0.31% to 7,430.27 and U.K.’s FTSE 100 loss 0.01% to 8,205.71.
Benchmark 10-year U.S. Treasury fail as demand for safe assets slipped again, today 10-year bond yields 0.67% to 3.6200.
Crude prices bounced on Wednesday as concerns about Tropical Storm Francine disrupting supply of oil outweighed worries about demand.
Spot Brent crude oil increase 1.50% to $70.23 per barrel. US West Texas Intermediate crude is increase 1.72% to $66.88 a barrel.
The yellow metal gold is up 0.36% to 2,552.30 dollars per ounce.
Market Wrap: Forex
The Japanese yen was among the biggest beneficiaries of this trade, with increased safe haven demand after the debate putting the yen at its strongest level since early-January. The yen also benefited from somewhat hawkish-leaning comments from Bank of Japan officials.
Today, the U.S. dollar index measures the Greenback against a trade-weighted basket of six major currencies, which decrease 0.19% to 101.407.
The Euro US Dollar (EUR/USD) is a widely traded is up 0.22% today. This left the pair trading around $1.10440.
The Japanese yen was will move negative against the U.S. dollar on Wednesday. Today USD/JPY is trades pair that decrease 0.57% to the 141.620 level.
Another commodity-related currency positive against the U.S dollar, AUD/USD gain 0.18% to 0.66630, and NZD/USD increase 0.01% to 0.61490 level.
EUR/USD Intraday: Trend on the upside
Our pivot point is at 1.10430
Preferable Price Action: Take buy positions above pivot level with targets at 1.10590 & 1.10730 in extension.
Alternative Price Action: Sell pivot looks for a further downside to 1.10270 & 1.10130.
Comment: RSI is above 50 levels and Pairs above its 20MA & 55MA.
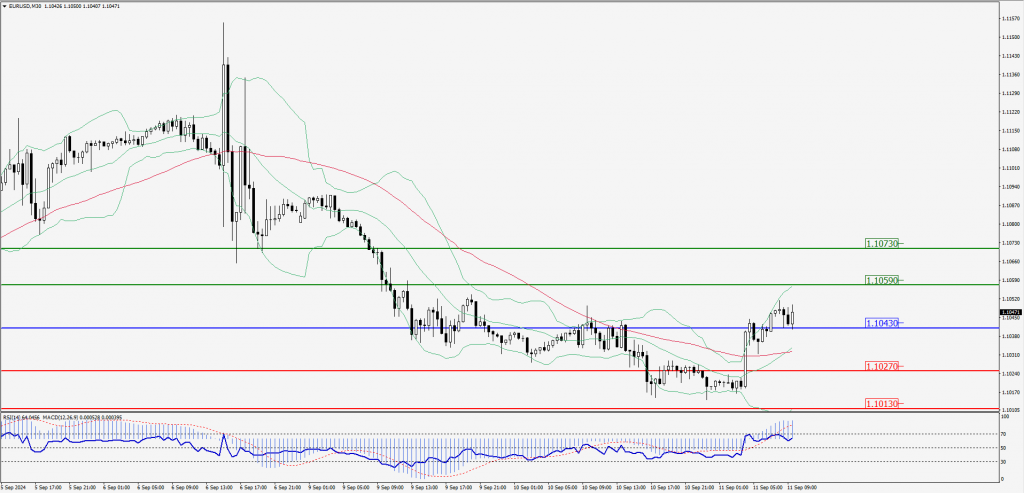
Green Lines Indicate Resistance Levels – Red Lines Indicate Support Levels
Light Blue is a Pivot Point – Black represents the price when the report was produced
GBP/USD Intraday: Support level at 1.30840
Our pivot point is at 1.30840
Preferable Price Action: Buy positions above pivot with targets at 1.31100 & 1.31340 in extension.
Alternative Price Action: The price below pivot would call for further downside to 1.30620 & 1.30390.
Comment: RSI is above 50 levels and Pairs above its 55MA.
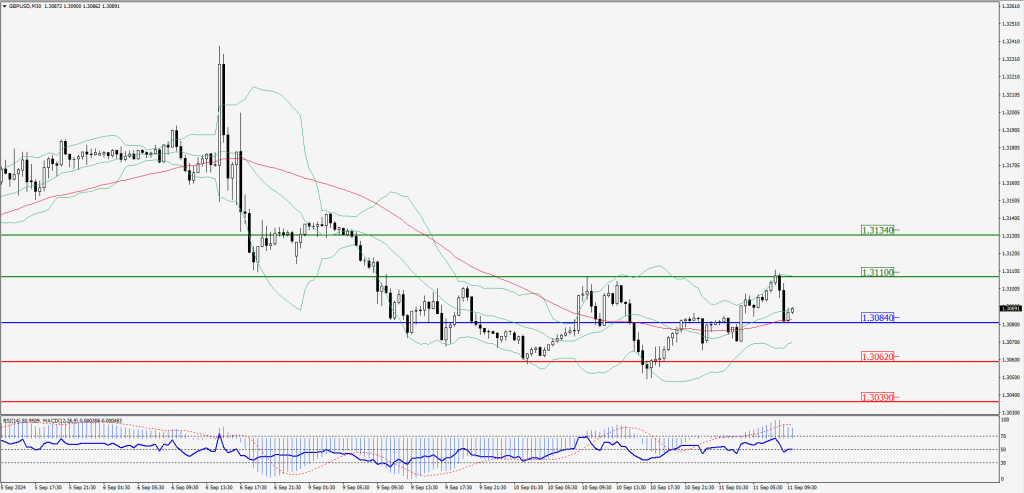
Green Lines Indicate Resistance Levels – Red Lines Indicate Support Levels
Light Blue is a Pivot Point – Black represents the price when the report was produced
USD/JPY Intraday: Trend on the downside
Our pivot point is at 141.510
Preferable Price Action: Sell position below pivot with the target at 141.100 and 140.710 in extension.
Alternative Price Action: The upside breakout of the pivot would call for 141.940 and 142.350.
Comment: MACD is below 50 levels and Pairs below its 55MA & 20MA.
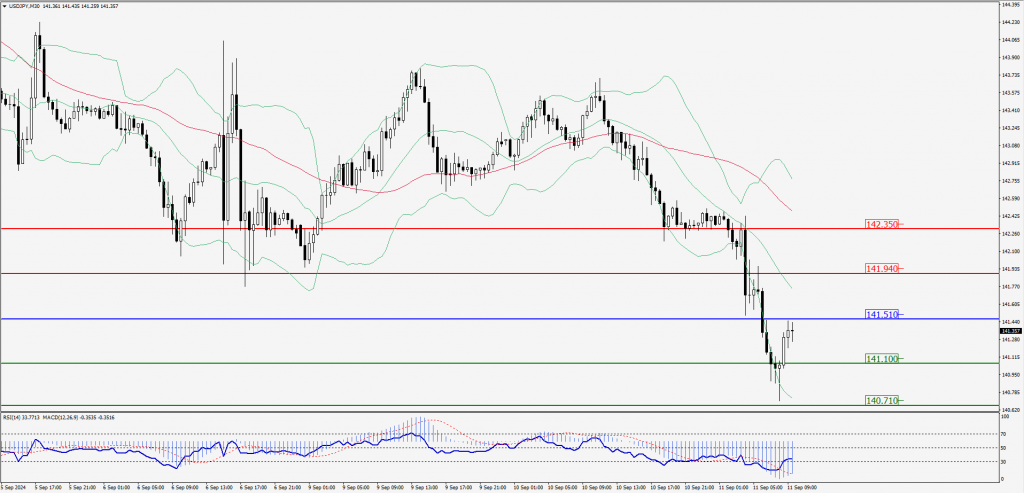
Green Lines Indicate Resistance Levels – Red Lines Indicate Support Levels
Light Blue is a Pivot Point – Black represents the price when the report was produced
AUD/USD Intraday: Trend on the upside
Our pivot point is at 0.66610
Preferable Price Action: Buy positions above pivot with targets at 0.66770 & 0.66930 in extension.
Alternative Price Action: Below pivot a further downside with 0.66440 & 0.66290 as targets.
Comment: RSI is above 50 levels and pairs above its 20MA & 55MA.
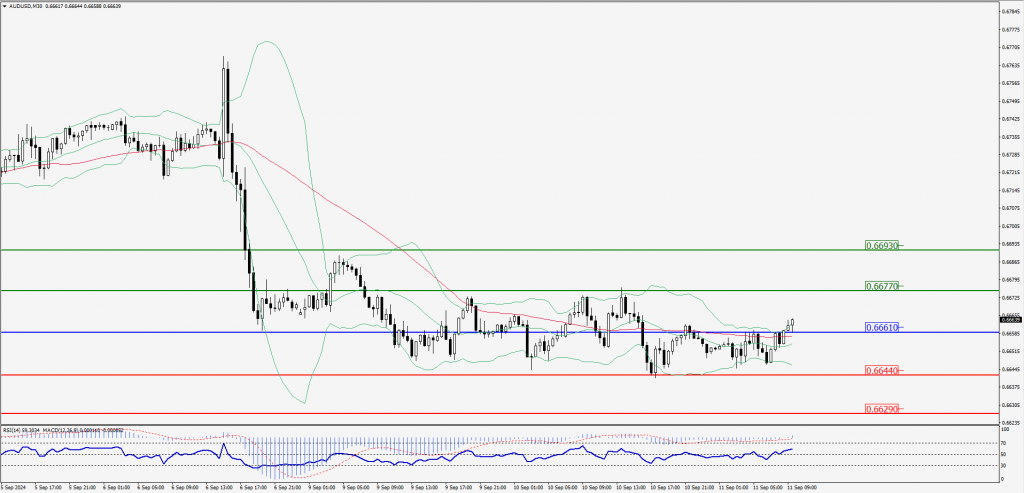
Green Lines Indicate Resistance Levels – Red Lines Indicate Support Levels
Light Blue is a Pivot Point – Black represents the price when the report was produced
CRUDEOIL Intraday: Trend on the upside
Our pivot point is at 67.88
Preferable Price Action: Above pivot buy oil with 66.55 & 67.15 as targets.
Alternative Price Action: Sell crude below pivot with targets at 65.23 and 64.64 in extension.
Comment: RSI is at above 50 levels and pairs above its 20MA.
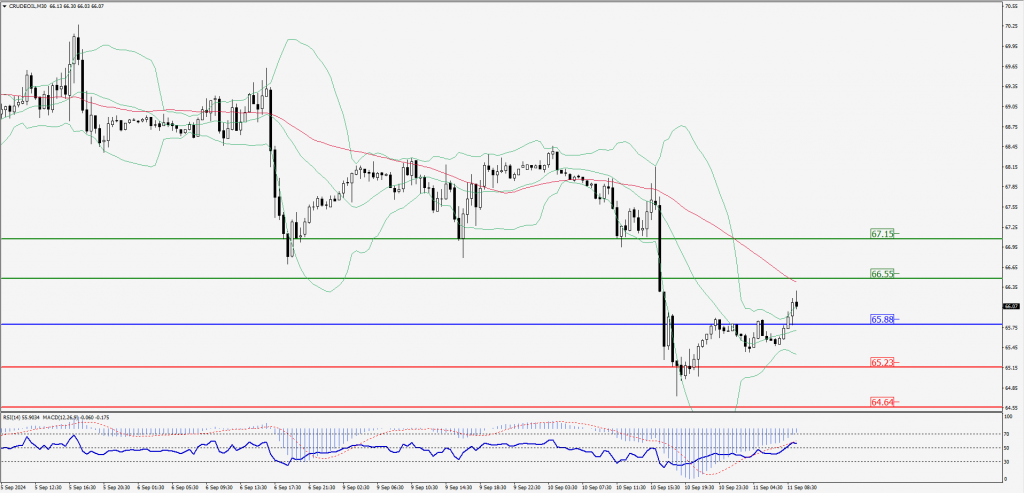
Green Lines Indicate Resistance Levels – Red Lines Indicate Support Levels
Light Blue is a Pivot Point – Black represents the price when the report was produced
XAU/USD Intraday: Trend on the upside
Our pivot point is at 2524.30
Preferable Price Action: Further upside to 2531.60 and 2537.80.
Alternative Price Action: If the price gives an downside breakout of a pivot, then the price extends to 2516.50 and 2509.90.
Comment: MACD is above 50 levels and pairs above its 55MA & 20MA.
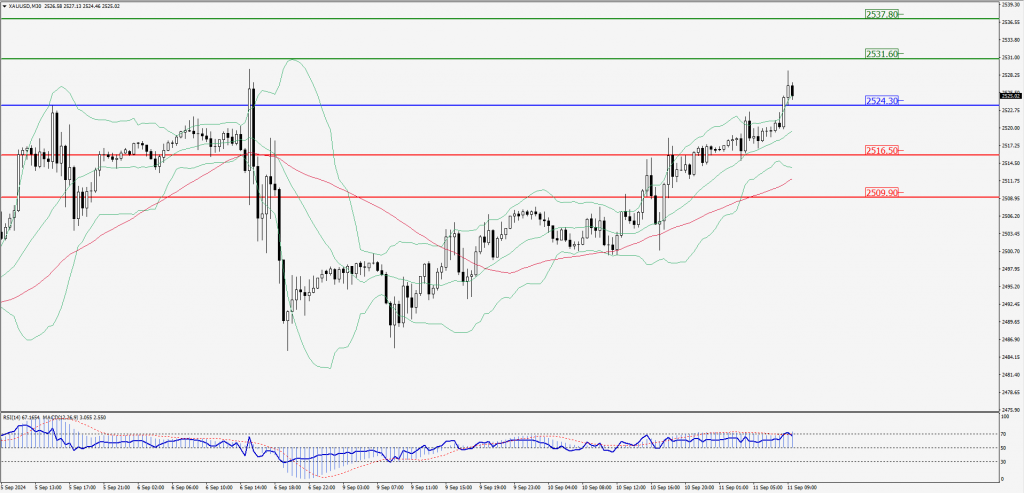
Green Lines Indicate Resistance Levels – Red Lines Indicate Support Levels
Light Blue is a Pivot Point – Black represents the price when the report was produced
Dow Jones Intraday: Trend on the downside
Our pivot point is 40,677.50
Preferable Price Action: Take sell positions below the pivot with targets at 40,548.40 & 40,431.70.
Alternative Price Action: Above 40,677.50 looks for further upside to 40,800.40 & 40,913.30.
Comment: RSI is below 50 levels and pairs below its 55MA.
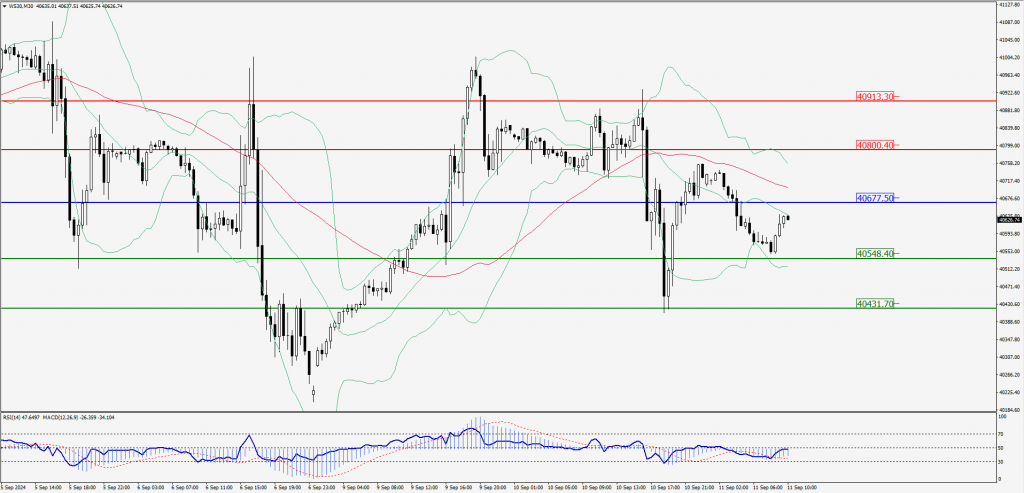
Green Lines Indicate Resistance Levels – Red Lines Indicate Support Levels
Light Blue is a Pivot Point – Black represents the price when the report was produced