EUR/USD Intraday: Trend on the downside
Our pivot point is at 1.14900
Preferable Price Action: Take Short positions below pivot level with targets at 1.14530 & 1.14140 in extension.
Alternative Price Action: Above pivot looks for a further upside to 1.15320 & 1.15790.
Comment: Pair above its 55MA & 20MA and RSI above 50 levels.
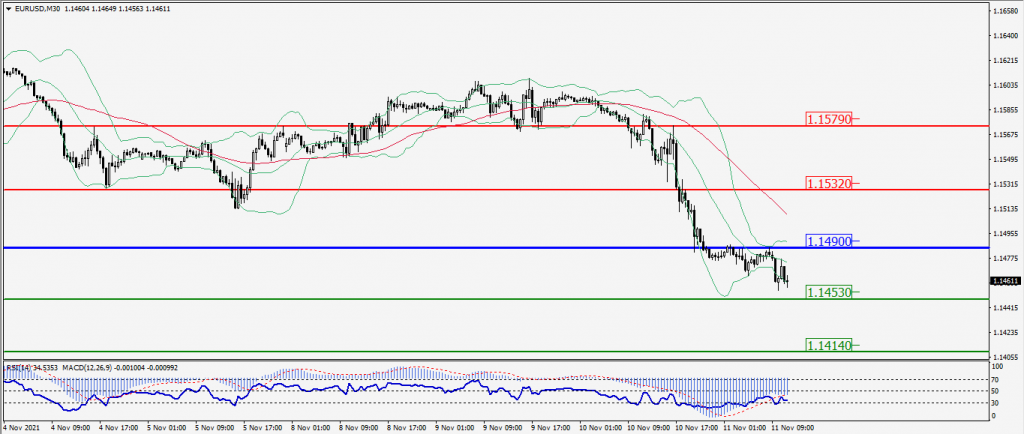
Green Lines Indicate Resistance Levels – Red Lines Indicates Support Levels
Light Blue is a Pivot Point – Black represents the price when the report was produced
GBP/USD Intraday: Resistance at 1.35410
Our pivot point is at 1.35410
Preferable Price Action: Buy positions above pivot with targets at 1.36100 & 1.36990 in extension.
Alternative Price Action: The price below pivot would call for further downside to 1.33520 & 1.32500.
Comment: Pair below its 50MA & 20MA and RSI below 50 levels.
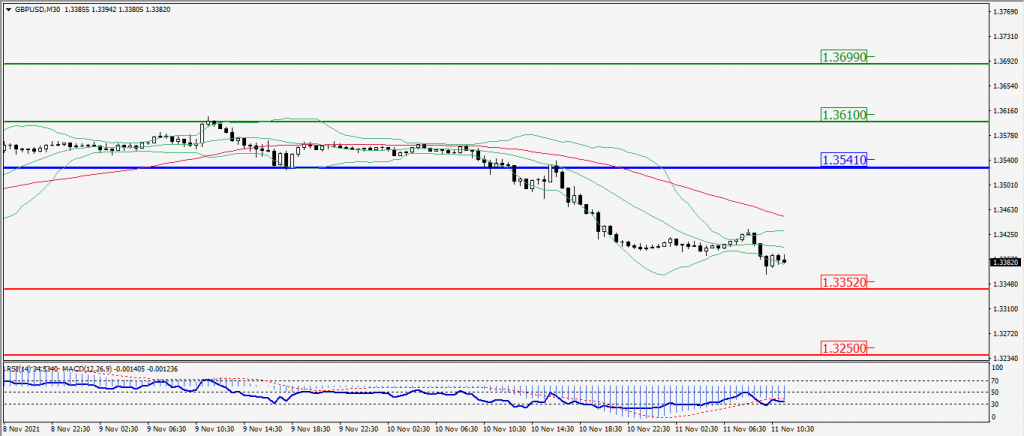
Green Lines Indicate Resistance Levels – Red Lines Indicates Support Levels
Light Blue is a Pivot Point – Black represents the price when the report was produced
USD/JPY Intraday: Resistance at 113.880
Our pivot point is at 113.880
Preferable Price Action: Sell position below pivot with the target at 112.840 and 112.210 in extension.
Alternative Price Action: The downside breakout of the pivot would call for 114.740 and 115.420.
Comment: Price below its 55MA & 20MA and MACD in negative territory.
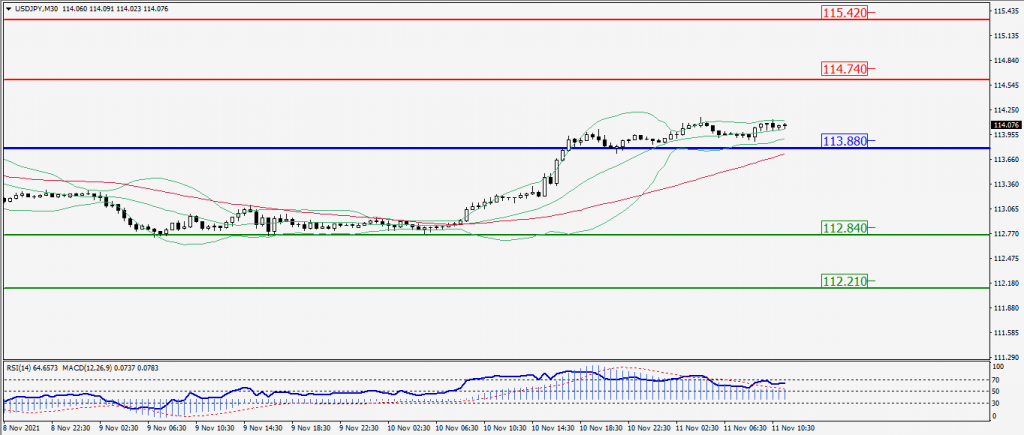
Green Lines Indicate Resistance Levels – Red Lines Indicates Support Levels
Light Blue is a Pivot Point – Black represents the price when the report was produced
AUD/USD Intraday: Break support level
Our pivot point is at 0.73050
Preferable Price Action: Sell Positions below pivot with targets at 0.72670 & 0.72260 in extension.
Alternative Price Action: Above pivot looks for a further upside with 0.73560 & 0.74030 as targets.
Comment: Pair below its 55MA & 20MA and RSI below 50 levels.
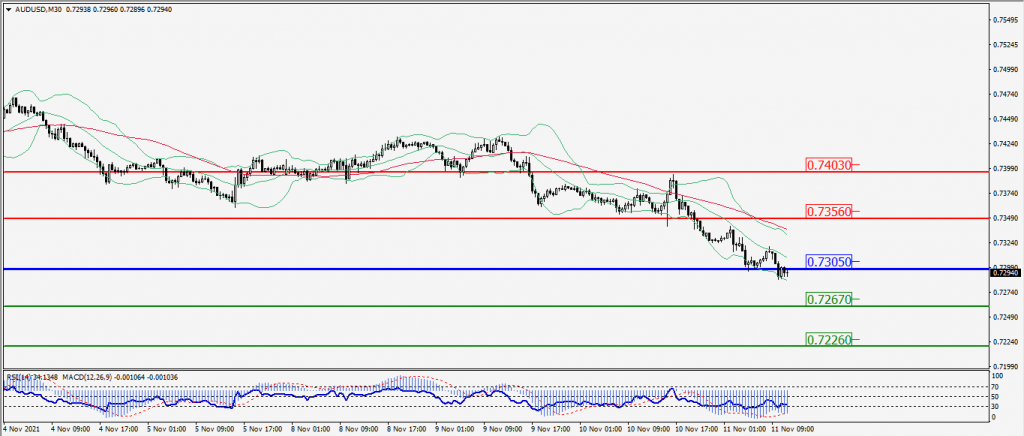
Green Lines Indicate Resistance Levels – Red Lines Indicates Support Levels
Light Blue is a Pivot Point – Black represents the price when the report was produced
CRUDEOIL Intraday: Trend on the downside
Our pivot point is at 81.60
Preferable Price Action: Above pivots buy Oil with 83.40 & 85.60 as targets.
Alternative Price Action: Sell crude below pivot with targets at 80.00 and 78.50 in extension.
Comment: Crude is above its 55MA & 20MA and MACD in the positive territory.
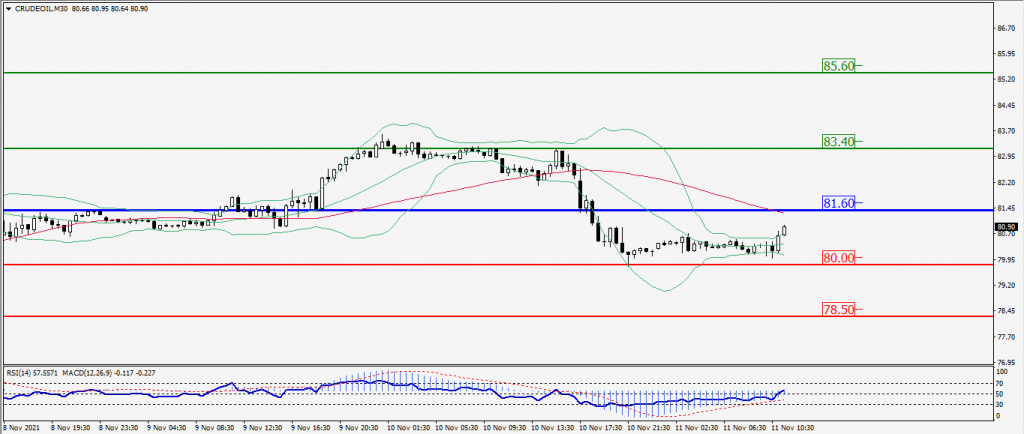
Green Lines Indicate Resistance Levels – Red Lines Indicates Support Levels
Light Blue is a Pivot Point – Black represents the price when the report was produced
XAU/USD Intraday: Trend on the upside
Our pivot point is 1857.50
Preferable Price Action: Further Upside to 1873.10 and 1890.00
Alternative Price Action: If the price gives a Downside breakout of a pivot, then the price extends to 1835.90 and 1813.10
Comment: MACD in flat territory and price above its 55MA.
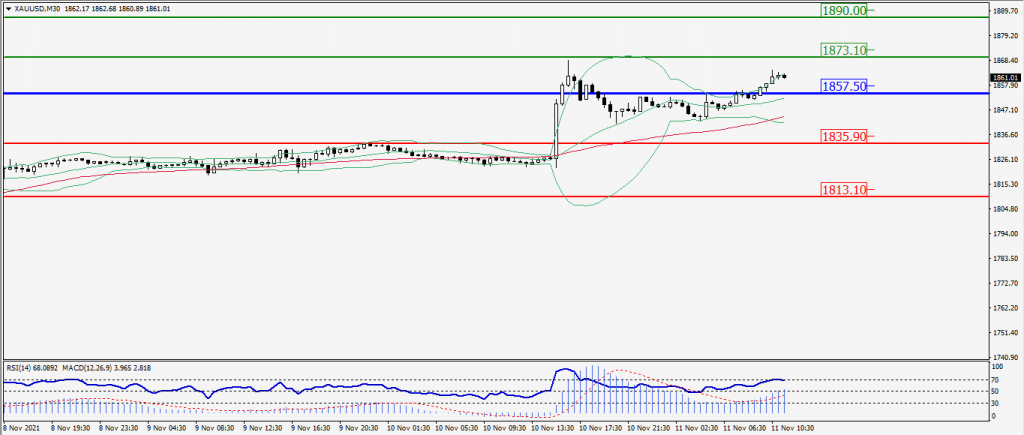
Green Lines Indicate Resistance Levels – Red Lines Indicates Support Levels
Light Blue is a Pivot Point – Black represents the price when the report was produced
Dow Jones Intraday: Support at 36,150.00
Our pivot point is 36,130.00
Preferable Price Action: Take long positions above pivot with targets at 36,320.00 & 36,520.00.
Alternative Price Action: Below looks for further downside to 35,900.00 & 35,750.00.
Comment: Price above its 55MA and RSI above 50 levels.
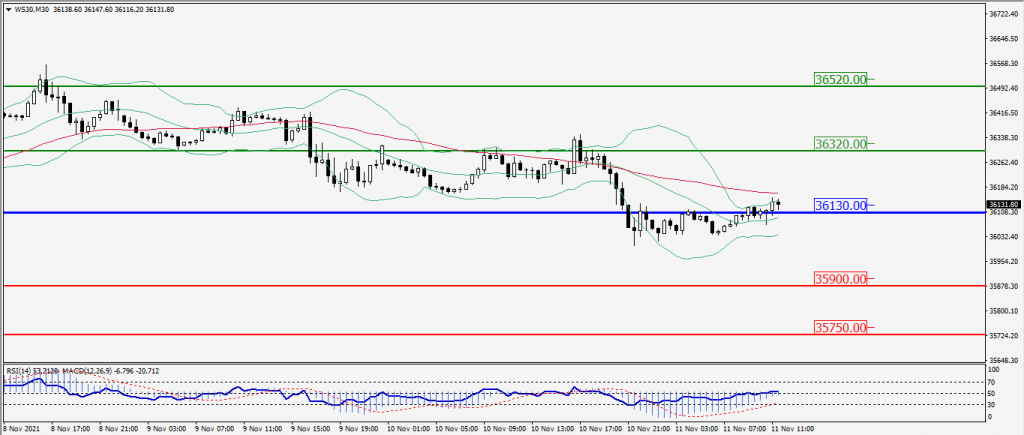
Green Lines Indicate Resistance Levels – Red Lines Indicates Support Levels
Light Blue is a Pivot Point – Black represents the price when the report was produced