EUR/USD Intraday: Trend on the downside
Our pivot point is at 1.15930
Preferable Price Action: Take Short positions below pivot level with targets at 1.15480 & 1.15160 in extension.
Alternative Price Action: Above pivot looks for a further upside to 1.16290 & 1.16580.
Comment: Pair above its 55MA & 20MA and RSI above 50 levels.
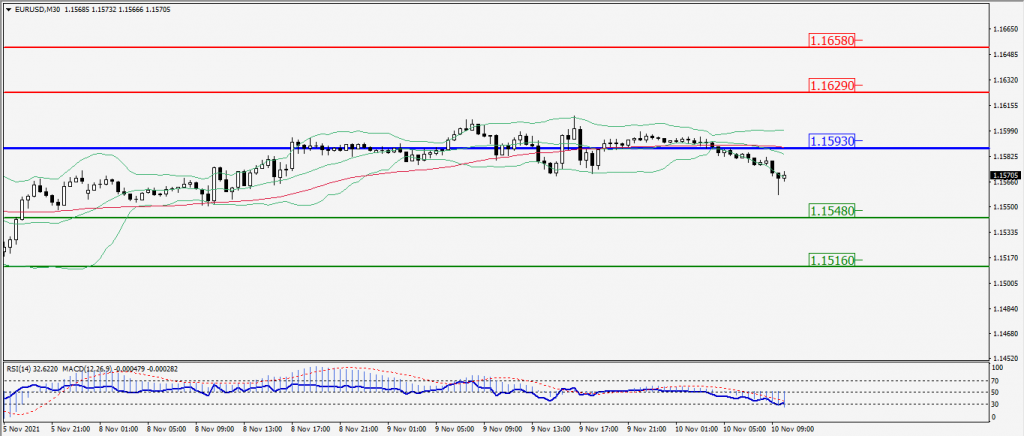
Green Lines Indicate Resistance Levels – Red Lines Indicates Support Levels
Light Blue is a Pivot Point – Black represents the price when the report was produced
GBP/USD Intraday: Resistance at 1.35370
Our pivot point is at 1.35370
Preferable Price Action: Buy positions above pivot with targets at 1.36050 & 1.36870 in extension.
Alternative Price Action: The price below pivot would call for further downside to 1.34750 & 1.34170.
Comment: Pair below its 50MA & 20MA and RSI below 50 levels.
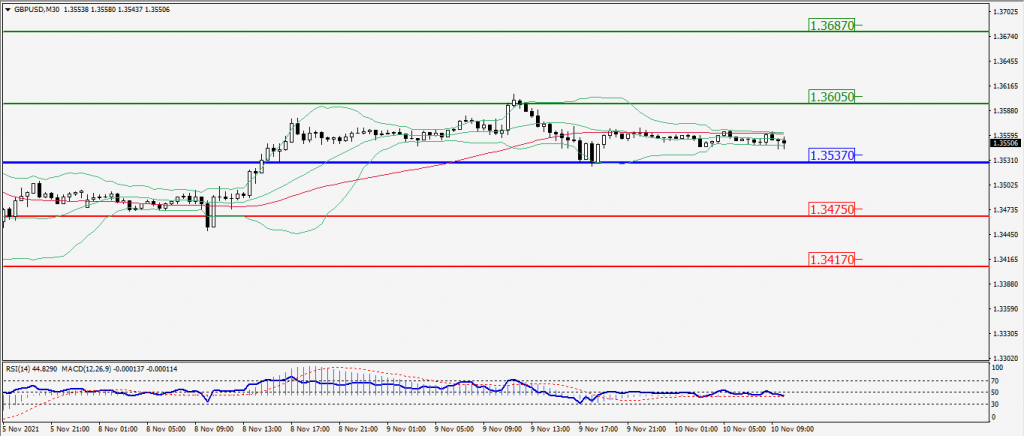
Green Lines Indicate Resistance Levels – Red Lines Indicates Support Levels
Light Blue is a Pivot Point – Black represents the price when the report was produced
USD/JPY Intraday: Resistance at 113.350
Our pivot point is at 113.350
Preferable Price Action: Sell position below pivot with the target at 112.560 and 112.100 in extension.
Alternative Price Action: The downside breakout of the pivot would call for 113.920 and 114.410.
Comment: Price below its 55MA & 20MA and MACD in negative territory.
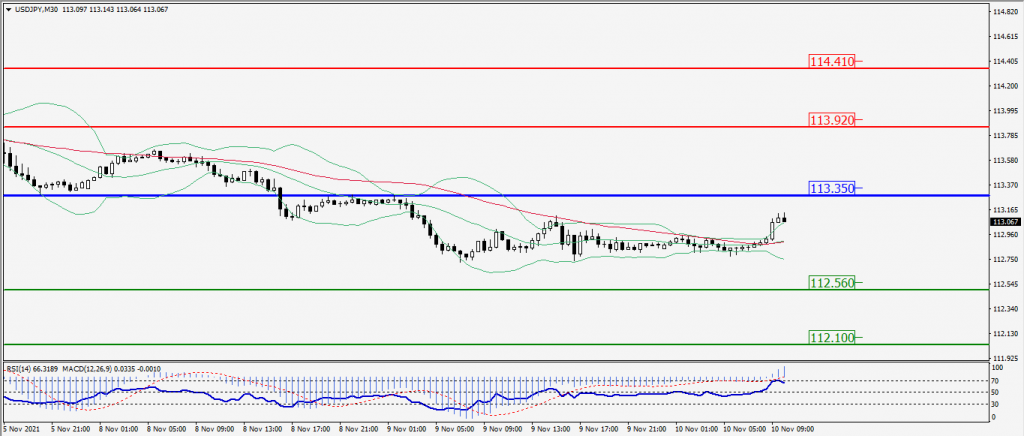
Green Lines Indicate Resistance Levels – Red Lines Indicates Support Levels
Light Blue is a Pivot Point – Black represents the price when the report was produced
AUD/USD Intraday: Break support level
Our pivot point is at 0.74000
Preferable Price Action: Sell Positions below pivot with targets at 0.73460 & 0.73000 in extension.
Alternative Price Action: Above pivot looks for a further upside with 0.74390 & 0.74880 as targets.
Comment: Pair below its 55MA & 20MA and RSI below 50 levels.
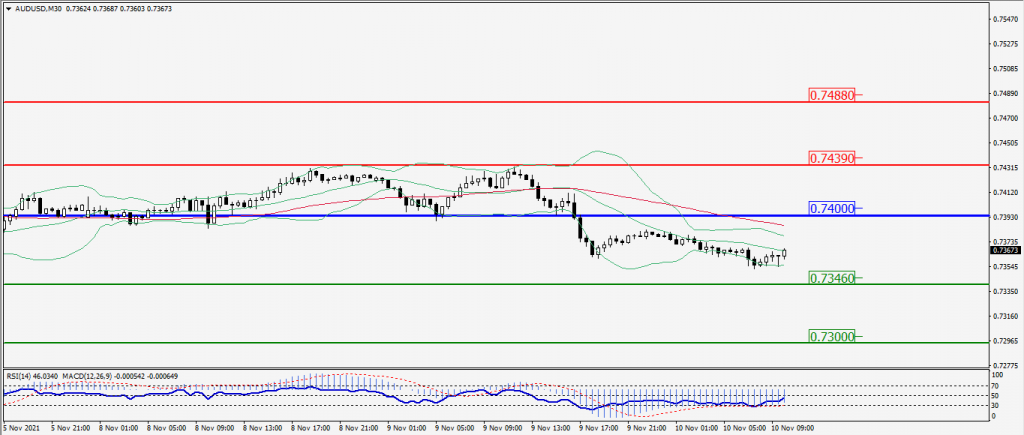
Green Lines Indicate Resistance Levels – Red Lines Indicates Support Levels
Light Blue is a Pivot Point – Black represents the price when the report was produced
CRUDEOIL Intraday: Trend on the downside
Our pivot point is at 82.90
Preferable Price Action: Above pivots buy Oil with 84.80 & 86.10 as targets.
Alternative Price Action: Sell crude below pivot with targets at 80.70 and 79.40 in extension.
Comment: Crude is above its 55MA & 20MA and MACD in the positive territory.
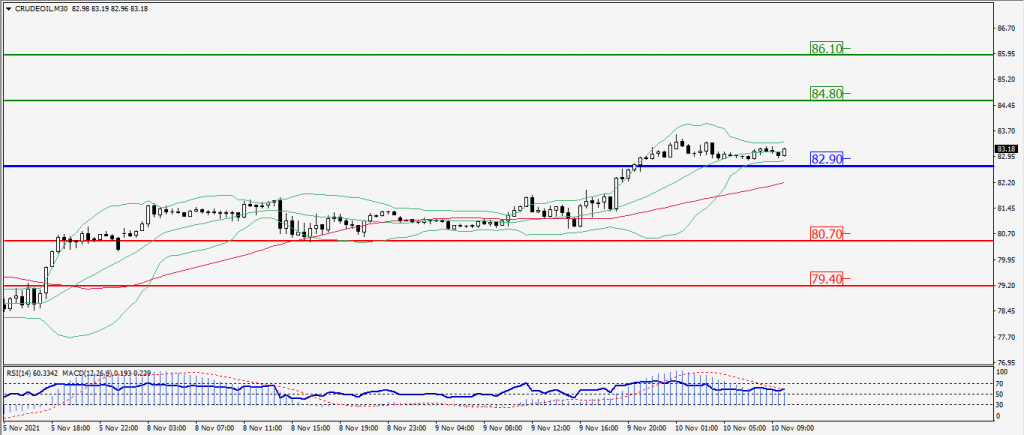
Green Lines Indicate Resistance Levels – Red Lines Indicates Support Levels
Light Blue is a Pivot Point – Black represents the price when the report was produced
XAU/USD Intraday: Trend on the upside
Our pivot point is 1822.60
Preferable Price Action: Further Upside to 1835.70 and 1855.20
Alternative Price Action: If the price gives a Downside breakout of a pivot, then the price extends to 1805.30 and 1793.20
Comment: MACD in flat territory and price above its 55MA.
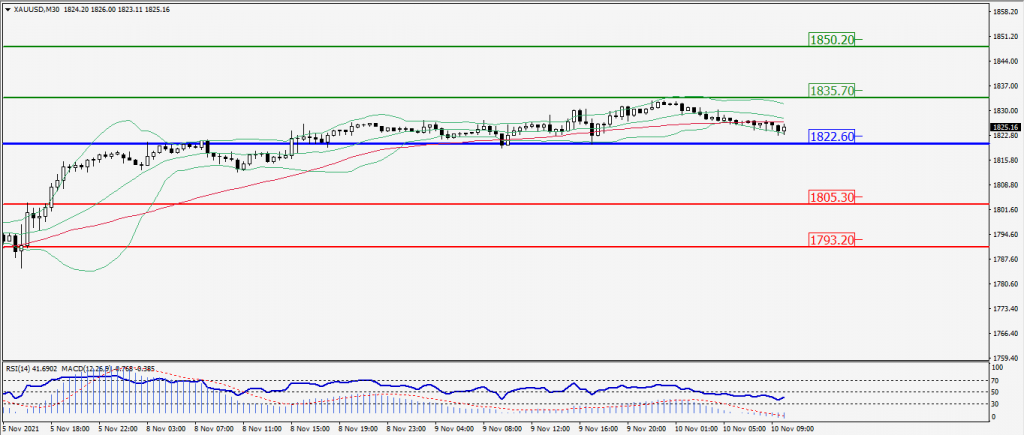
Green Lines Indicate Resistance Levels – Red Lines Indicates Support Levels
Light Blue is a Pivot Point – Black represents the price when the report was produced
Dow Jones Intraday: Support at 36,290.00
Our pivot point is 36,290.00
Preferable Price Action: Take long positions above pivot with targets at 36,520.00 & 36,690.00.
Alternative Price Action: Below looks for further downside to 36,030.00 & 35,860.00.
Comment: Price above its 55MA and RSI above 50 levels.
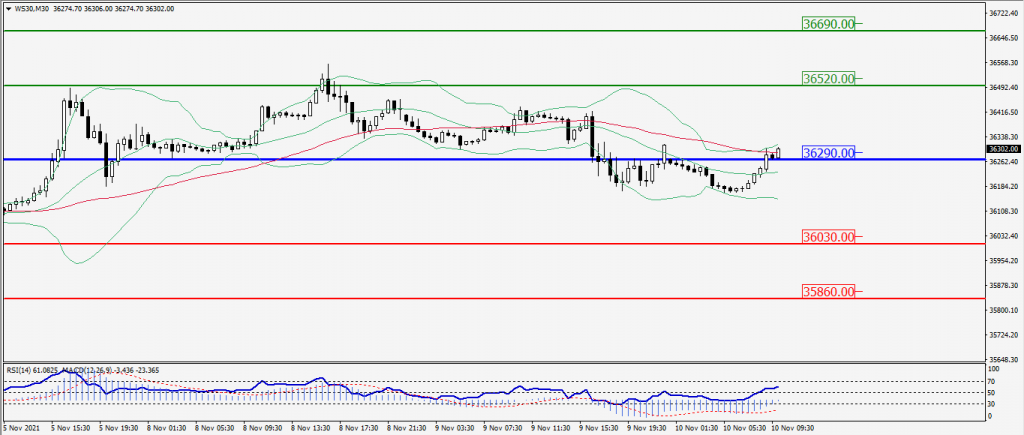
Green Lines Indicate Resistance Levels – Red Lines Indicates Support Levels
Light Blue is a Pivot Point – Black represents the price when the report was produced