Market Wrap: Stocks, Bonds, Commodities
The U.S. dollar stabilized in early European trade Thursday, remaining near a three-week low, after the first day of Fed Chair Jerome Powell’s two-day testimony on Capitol Hill, while the euro steadied amid political uncertainty.
The Dow Jones Industrial Average rose 429.39 points to 39,721.36, the S&P 500 gain 1.02% to 5,633.91 and the Nasdaq Composite ascend 216.68 points to 18,645.97.
MSCI’s index of Asia-Pacific stocks outside Japan is up 1.30% to 720.63 levels. The Australian index was higher by 0.93% to 7,889.60. Japanese Nikkei Index increase 1.00% today.
European stocks were positive on Thursday, with the Stoxx Europe 50 Index increase 0.57% to 4,987.05, Germany’s DAX ascend 0.31% to 18,475.05, and France’s CAC higher 0.71% to 7,627.52 and U.K.’s FTSE 100 gain 0.25% to 8,213.86.
Benchmark 10-year U.S. Treasury rose as demand for safe assets slipped again, today 10-year bond yields increase 0.21% to 4.2870.
Oil prices gained on Thursday as crude stocks fell after U.S. refineries ramped up processing and as gasoline inventories eased, signalling stronger demand.
Spot Brent crude oil increase 0.40% to $85.42 per barrel. US West Texas Intermediate crude is increase 0.38% to $82.41 a barrel.
The yellow metal gold is up 0.27% to 2,386.10 dollars per ounce.
Market Wrap: Forex
Most Asian currencies rose on Thursday as the dollar lost ground after comments from Federal Reserve Chair Jerome Powell sparked more optimism over interest rate cuts, putting upcoming inflation data squarely in focus.
Today, the U.S. dollar index measures the Greenback against a trade-weighted basket of six major currencies, which decrease 0.10% to 104.6240.
The Euro US Dollar (EUR/USD) is a widely traded pair that is ascend 0.09% today. This left the pair trading around $1.08400.
The Japanese yen was negative against the U.S. dollar on Thursday. Today USD/JPY is trades pair that decreases 0.04% to the 161.610 level.
Another commodity-related currency positive against the U.S dollar, AUD/USD increase 0.13% to 0.67560, and NZD/USD increase 0.13% to 0.60890 level.
EUR/USD Intraday: Support level at 1.08320
Our pivot point is at 1.08320
Preferable Price Action: Take Buy positions above pivot level with targets at 1.08390 & 1.08440 in extension.
Alternative Price Action: Sell pivot looks for a further downside to 1.08250 & 1.08200.
Comment: RSI is above 50 levels and Pairs above its 55MA.

Green Lines Indicate Resistance Levels – Red Lines Indicate Support Levels
Light Blue is a Pivot Point – Black represents the price when the report was produced
GBP/USD Intraday: Trend on the upside
Our pivot point is at 1.28560
Preferable Price Action: Buy positions above pivot with targets at 1.28720 & 1.28870 in extension.
Alternative Price Action: The price below pivot would call for further downside to 1.28400 & 1.28250.
Comment: RSI is above 50 levels and Pairs above its 55MA.

Green Lines Indicate Resistance Levels – Red Lines Indicate Support Levels
Light Blue is a Pivot Point – Black represents the price when the report was produced
USD/JPY Intraday: Trend on the upside
Our pivot point is at 161.640
Preferable Price Action: Buy position above pivot with the target at 161.840 and 162.010 in extension.
Alternative Price Action: The downside breakout of the pivot would call for 161.430 and 161.240.
Comment: MACD is above 50 levels and Pairs above its 55MA.

Green Lines Indicate Resistance Levels – Red Lines Indicate Support Levels
Light Blue is a Pivot Point – Black represents the price when the report was produced
AUD/USD Intraday: Trend on the upside
Our pivot point is at 0.67520
Preferable Price Action: Buy positions above pivot with targets at 0.67590 & 0.67650 in extension.
Alternative Price Action: Below pivot a further downside with 0.67450 & 0.67390 as targets.
Comment: RSI is above 50 levels and Pairs above its 55MA.
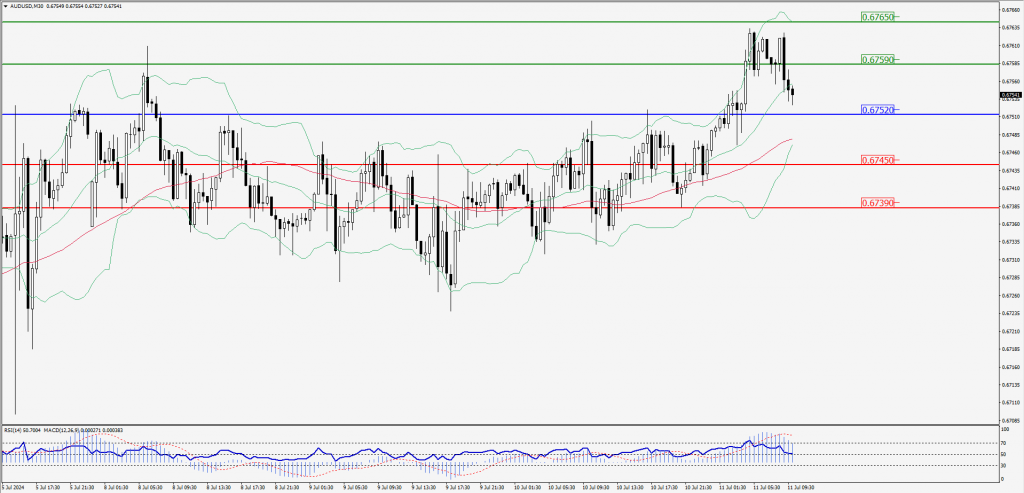
Green Lines Indicate Resistance Levels – Red Lines Indicate Support Levels
Light Blue is a Pivot Point – Black represents the price when the report was produced
CRUDEOIL Intraday: Trend on the upside
Our pivot point is at 81.58
Preferable Price Action: Above pivot buy oil with 82.12 & 82.56 as targets.
Alternative Price Action: Sell crude below pivot with targets at 81.04 and 80.55 in extension.
Comment: RSI is above 50 levels and pairs above its 20MA.

Green Lines Indicate Resistance Levels – Red Lines Indicate Support Levels
Light Blue is a Pivot Point – Black represents the price when the report was produced
XAU/USD Intraday: Trend on the upside
Our pivot point is 2379.40
Preferable Price Action: Further upside to 2385.50 and 2391.10.
Alternative Price Action: If the price gives an downside breakout of a pivot, then the price extends to 2373.20 and 2368.00.
Comment: MACD is above 50 levels and Pairs above its 55MA & 20MA.

Green Lines Indicate Resistance Levels – Red Lines Indicate Support Levels
Light Blue is a Pivot Point – Black represents the price when the report was produced
Dow Jones Intraday: Trend on the upside
Our pivot point is 39,664.20
Preferable Price Action: Take buy positions above the pivot with targets at 39760.00 & 39833.70.
Alternative Price Action: Below 39,664.20 looks for further downside to 39,568.50 & 39,486.40.
Comment: RSI is above 50 levels and pairs above its 55MA.

Green Lines Indicate Resistance Levels – Red Lines Indicate Support Levels
Light Blue is a Pivot Point – Black represents the price when the report was produced