Market Wrap: Stocks, Bonds, Commodities
The yen sank to a fresh 38-year low against the U.S. dollar and a record trough versus the euro on Wednesday, as the Japanese unit continued its downward spiral, with market participants on high alert for Japan intervention to boost the currency.
The Dow Jones Industrial Average fell 52.82 points to 39,291.97, the S&P 500 gain 0.07% to 5,576.98 and the Nasdaq Composite ascend 26.82 points to 18,430.56.
MSCI’s index of Asia-Pacific stocks outside Japan is down 0.19% to 710.61 levels. The Australian index was lower by 0.16% to 7,816.80. Japanese Nikkei Index increase 0.50% today.
European stocks were positive on Wednesday, with the Stoxx Europe 50 Index increase 0.12% to 4,909.55, Germany’s DAX ascend 0.30% to 18,278.05, and France’s CAC higher 0.13% to 7,518.73 and U.K.’s FTSE 100 gain 0.19% to 8,154.89.
Benchmark 10-year U.S. Treasury rose as demand for safe assets slipped again, today 10-year bond yields decrease 0.26% to 4.2870.
Oil prices dipped on Wednesday as the impact from Hurricane Beryl dissipated and inflation data highlighted stubbornly weak consumer demand in top crude importer China.
Spot Brent crude oil decrease 0.19% to $84.50 per barrel. US West Texas Intermediate crude is decrease 0.16% to $81.28 a barrel.
The yellow metal gold is up 0.48% to 2,379.30 dollars per ounce.
Market Wrap: Forex
The dollar index and dollar index futures recovered further from recent losses, steadying in Asian trade after Powell flagged cooling in the labor market and progress towards bringing down inflation.
Today, the U.S. dollar index measures the Greenback against a trade-weighted basket of six major currencies, which increase 0.04% to 104.8450.
The Euro US Dollar (EUR/USD) is a widely traded pair that is Either up or down 0.00% today. This left the pair trading around $1.08120.
The Japanese yen was positive against the U.S. dollar on Wednesday. Today USD/JPY is trades pair that increases 0.14% to the 161.530 level.
Another commodity-related currency negative against the U.S dollar, AUD/USD decrease 0.09% to 0.67380, and NZD/USD decrease 0.93% to 0.60660 level.
EUR/USD Intraday: Support level at 1.08210
Our pivot point is at 1.08210
Preferable Price Action: Take Buy positions above pivot level with targets at 1.08280 & 1.08340 in extension.
Alternative Price Action: Sell pivot looks for a further downside to 1.08140 & 1.08080.
Comment: RSI is above 50 levels and Pairs above its 55MA & 20MA.
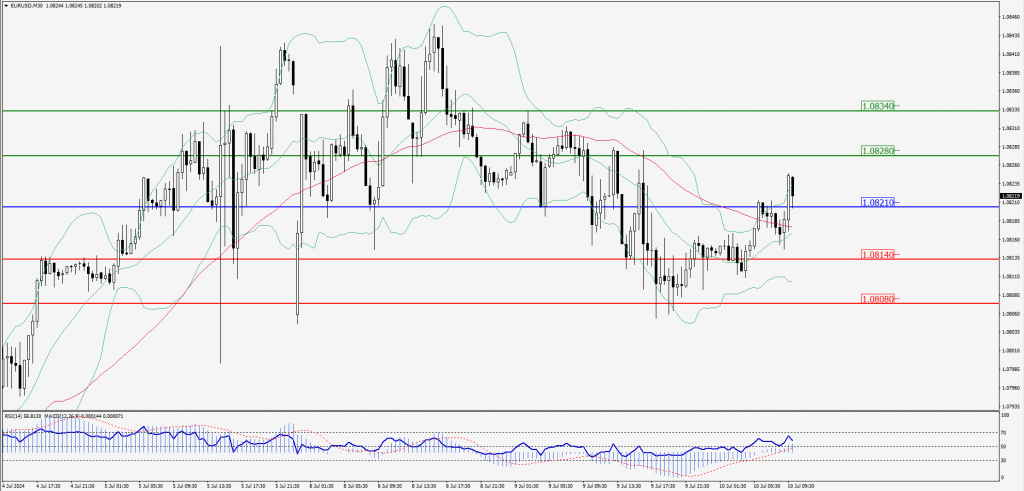
Green Lines Indicate Resistance Levels – Red Lines Indicate Support Levels
Light Blue is a Pivot Point – Black represents the price when the report was produced
GBP/USD Intraday: Trend on the upside
Our pivot point is at 1.27930
Preferable Price Action: Buy positions above pivot with targets at 1.28080 & 1.28200 in extension.
Alternative Price Action: The price below pivot would call for further downside to 1.27780 & 1.27650.
Comment: RSI is above 50 levels.
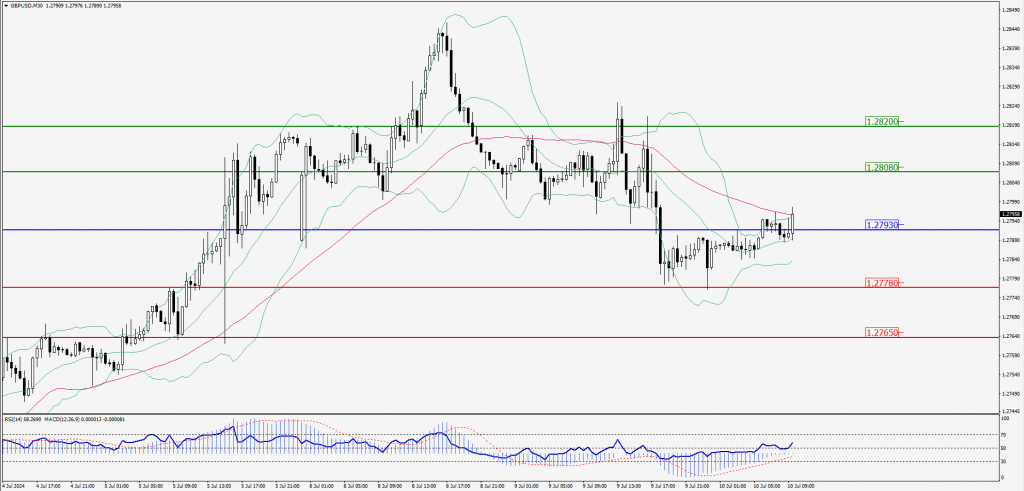
Green Lines Indicate Resistance Levels – Red Lines Indicate Support Levels
Light Blue is a Pivot Point – Black represents the price when the report was produced
USD/JPY Intraday: Trend on the downside
Our pivot point is at 161.450
Preferable Price Action: Sell position below pivot with the target at 161.250 and 161.070 in extension.
Alternative Price Action: The upside breakout of the pivot would call for 161.660 and 161.840.
Comment: MACD is below 50 levels and Pairs below its 20MA.
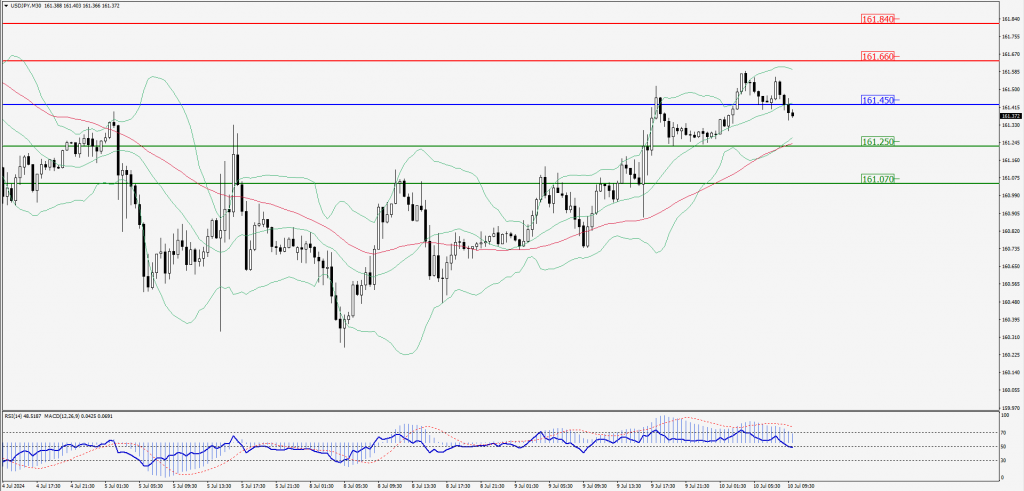
Green Lines Indicate Resistance Levels – Red Lines Indicate Support Levels
Light Blue is a Pivot Point – Black represents the price when the report was produced
AUD/USD Intraday: Trend on the upside
Our pivot point is at 0.67470
Preferable Price Action: Buy positions above pivot with targets at 0.67530 & 0.67590 in extension.
Alternative Price Action: Below pivot a further downside with 0.67410 & 0.67350 as targets.
Comment: RSI is above 50 levels and Pairs above its 20MA & 55MA.
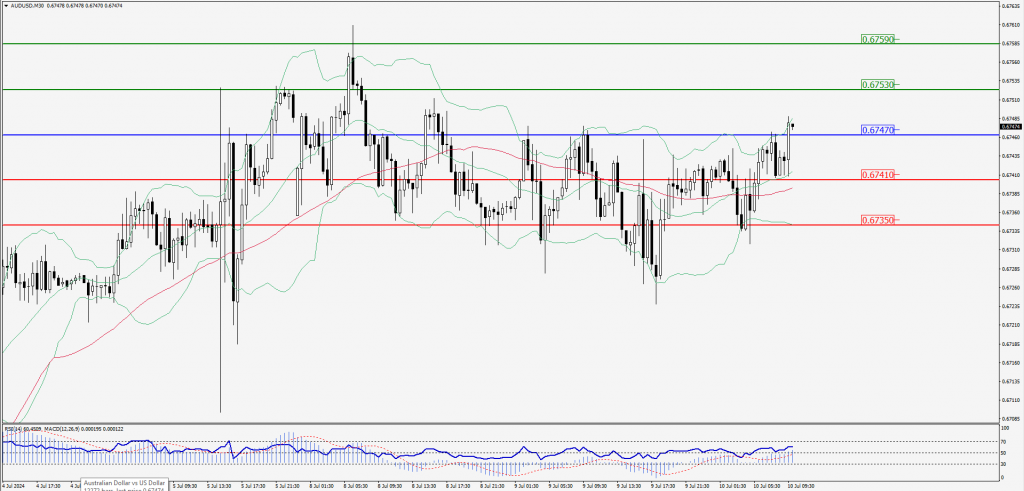
Green Lines Indicate Resistance Levels – Red Lines Indicate Support Levels
Light Blue is a Pivot Point – Black represents the price when the report was produced
CRUDEOIL Intraday: Major trend on the downside
Our pivot point is at 80.49
Preferable Price Action: Below pivot sell oil with 79.77 & 79.23 as targets.
Alternative Price Action: Buy crude above pivot with targets at 81.21 and 81.81 in extension.
Comment: RSI is below 50 levels and pairs below its 55MA & 20MA.
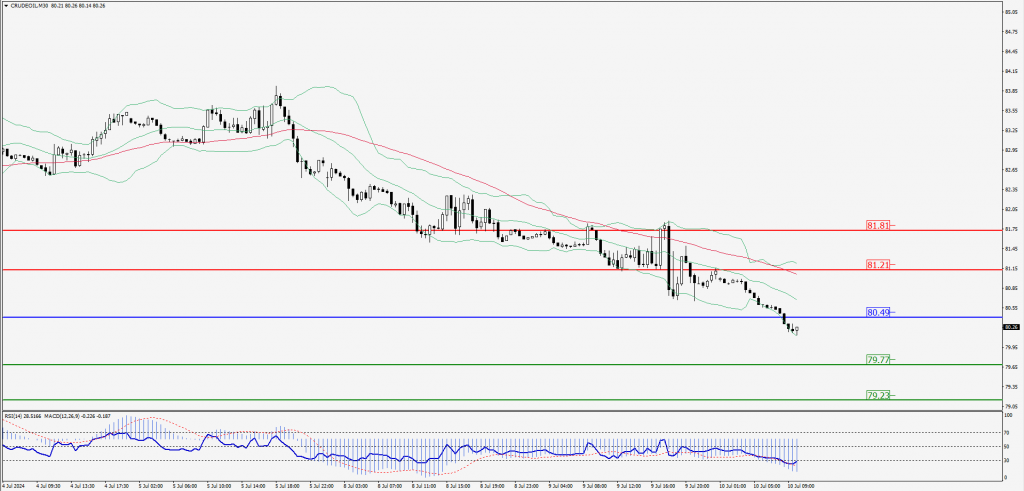
Green Lines Indicate Resistance Levels – Red Lines Indicate Support Levels
Light Blue is a Pivot Point – Black represents the price when the report was produced
XAU/USD Intraday: Trend on the upside
Our pivot point is 2370.40
Preferable Price Action: Further upside to 2376.30 and 2381.30.
Alternative Price Action: If the price gives an downside breakout of a pivot, then the price extends to 2364.70 and 2359.20.
Comment: MACD is above 50 levels and Pairs above its 55MA & 20MA.
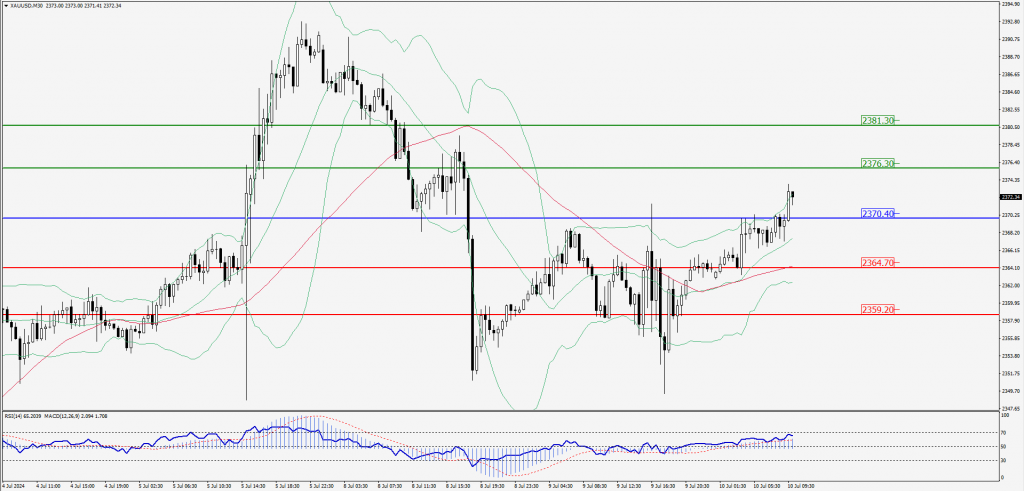
Green Lines Indicate Resistance Levels – Red Lines Indicate Support Levels
Light Blue is a Pivot Point – Black represents the price when the report was produced
Dow Jones Intraday: Trend on the downside
Our pivot point is 39,301.90
Preferable Price Action: Take sell positions below the pivot with targets at 39227.10 & 39165.70.
Alternative Price Action: Above 39,301.90 looks for further upside to 39,381.30 & 39,444.90.
Comment: RSI is below 50 levels and pairs below its 55MA.
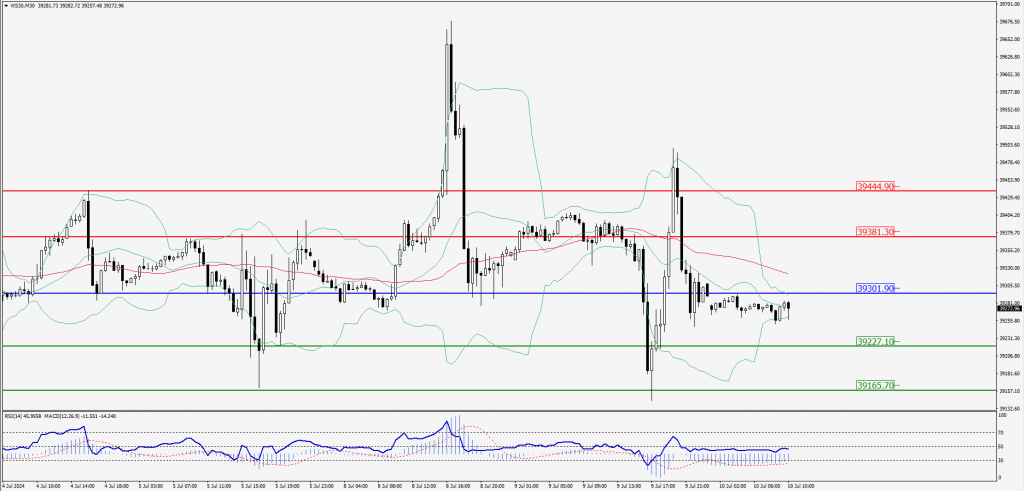
Green Lines Indicate Resistance Levels – Red Lines Indicate Support Levels
Light Blue is a Pivot Point – Black represents the price when the report was produced