Market Wrap: Stocks, Bonds, Commodities
Wall Street ended flat on Friday as Treasury yields jumped following a stronger-than-expected US jobs report, which suggested the Federal Reserve may push further interest rate hikes to cool the economy and slow inflation.
The Dow Jones Industrial Average fell 46.40 points to 31,338.15, the S&P 500 lose 3.24 points to 3,899.38 and the Nasdaq Composite add 13.96 points to 11,635.31.
MSCI’s index of Asia-Pacific stocks outside Japan is drop 1.72% to 642.04 levels. Australian index lower 1.14% to 6,602.20. Japanese Nikkei Index ascend 1.11% to 26,812.30.
European stocks were negative on Monday, with the Stoxx Europe 50 Index fell 1.07% to 3,469.05, Germany’s DAX decline 0.95% to 12,892.18, and France’s CAC drop 1.23% to 5,958.74, and U.K.’s FTSE 100 slipped 0.88% to 7,129.91.
Benchmark 10-year U.S. Treasury fell as demand for safe assets ascend again, today 10-year bond yields a negative 1.63% to 3.0500.
Oil prices fell on Monday in volatile trade, reversing some gains from the previous session as markets braced for new mass COVID testing in China potentially hitting demand, a worry that outweighed ongoing concerns about tight supply.
Spot Brent crude oil subtracts 2.27% to $104.62 per barrel. US West Texas Intermediate crude is down 2.45% to $102.22 a barrel.
The yellow metal gold is decline 0.35% to 1,736.25 dollars per ounce.
Market Wrap: Forex
The U.S. dollar surged to a new 20-year high in early European trade Monday, gaining strongly against the Japanese yen in particular, on fears about the global growth outlook ahead of the release later in the week of key U.S. inflation data.
Today, the U.S. dollar index measures the Greenback against a trade-weighted basket of six major currencies, which is rose 0.43% to 107.285.
The Euro US Dollar (EUR/USD) is a widely traded pair that is down 0.49% today. This left the pair trading around $1.01270.
The Japanese yen was positive against the U.S. dollar on Monday as the stock up. Today USD/JPY is ascend 0.58% to 136.880 level.
Another commodity-related currency negative against the U.S dollar, AUD/USD lose 0.65% to 0.68120, and NZD/USD down 0.31 to 0.61720 level.
EUR/USD Intraday: Trend on the downside
Our pivot point is at 1.01490
Preferable Price Action: Take sell positions below pivot level with targets at 1.00240 & 0.99380 in extension.
Alternative Price Action: Above pivot looks for a further upside to 1.02670 & 1.03560.
Comment: RSI below 50 levels and Pair below its 20MA & 55MA.
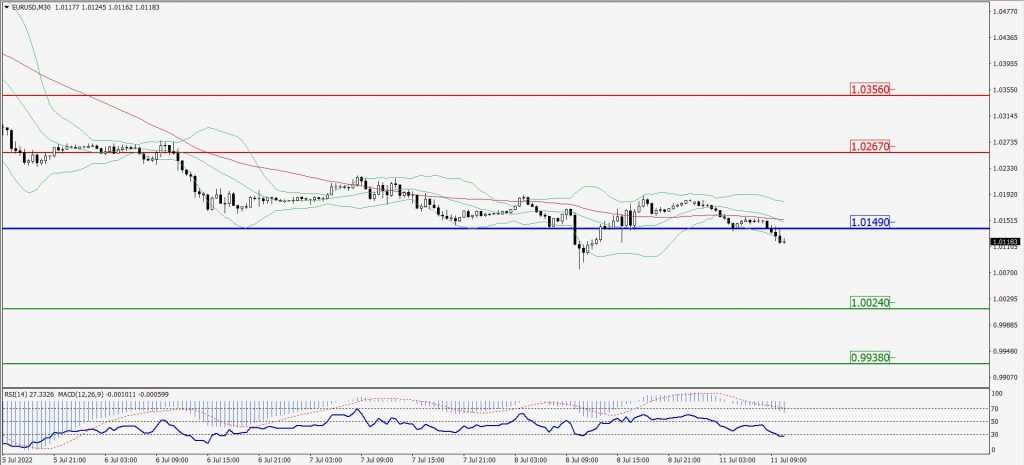
Green Lines Indicate Resistance Levels – Red Lines Indicate Support Levels
Light Blue is a Pivot Point – Black represents the price when the report was produced
GBP/USD Intraday: Trend on the downside
Our pivot point is at 1.20040
Preferable Price Action: Sell positions below pivot with targets at 1.18780 & 1.17840 in extension.
Alternative Price Action: The price above pivot would call for further upside to 1.21340 & 1.22370.
Comment: RSI below 50 levels pair below its 20MA & 55MA.
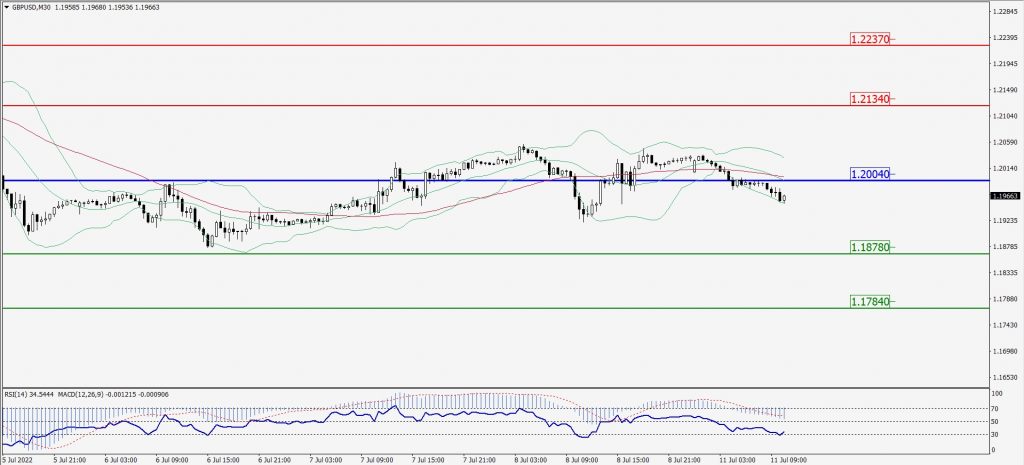
Green Lines Indicate Resistance Levels – Red Lines Indicate Support Levels
Light Blue is a Pivot Point – Black represents the price when the report was produced
USD/JPY Intraday: Trend on the upside
Our pivot point is at 136.550
Preferable Price Action: Buy position above pivot with the target at 137.490 and 138.140 in extension.
Alternative Price Action: The downside breakout of the pivot would call for 135.740 and 135.160.
Comment: MACD is positive territory and pairs above 55MA.
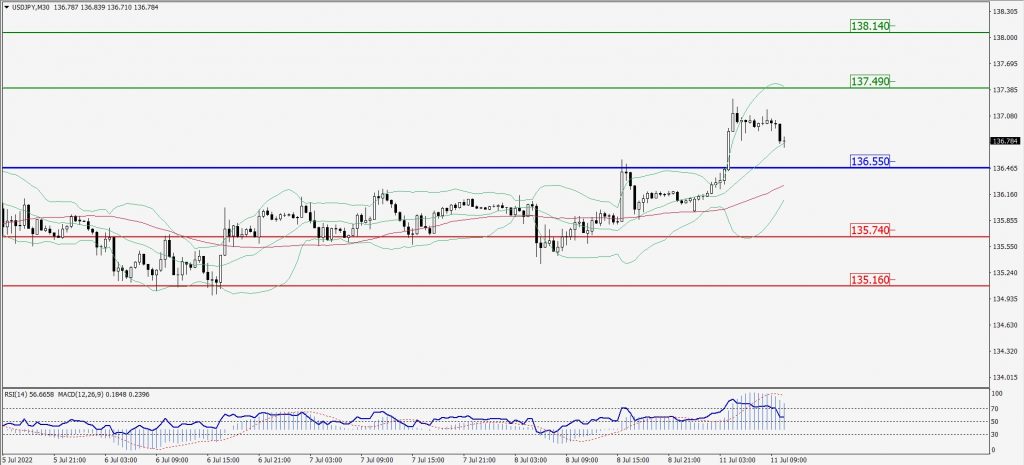
Green Lines Indicate Resistance Levels – Red Lines Indicate Support Levels
Light Blue is a Pivot Point – Black represents the price when the report was produced
AUD/USD Intraday: Resistance level at 0.68300
Our pivot point is at 0.68300
Preferable Price Action: Sell Positions below pivot with targets at 0.67670 & 0.67250 in extension.
Alternative Price Action: Above pivot looks for a further upside with 0.68850 & 0.69300 as targets.
Comment: RSI below 50 levels and Pair below its 20MA & 55MA.
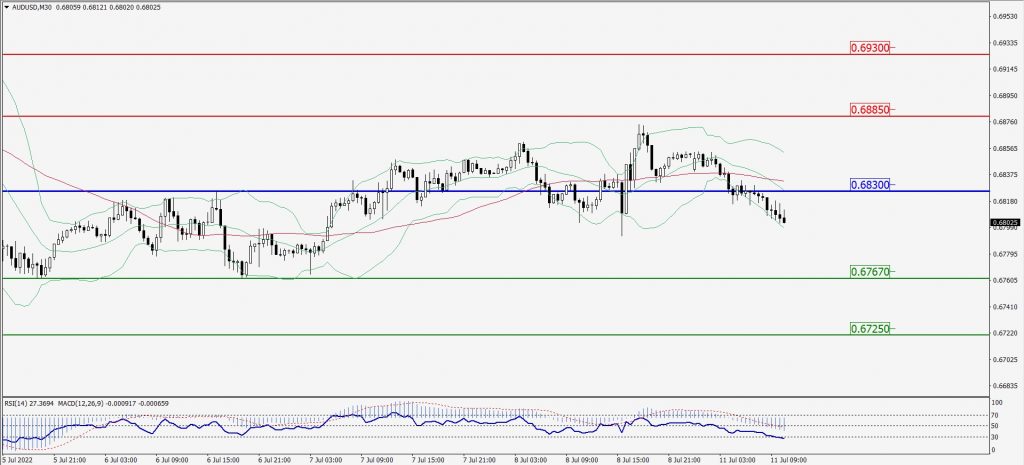
Green Lines Indicate Resistance Levels – Red Lines Indicate Support Levels
Light Blue is a Pivot Point – Black represents the price when the report was produced
CRUDEOIL Intraday: Major resistance level at 101.04
Our pivot point is at 101.04
Preferable Price Action: Below pivots sell oil with 97.28 & 94.79 as targets.
Alternative Price Action: Buy crude above pivot with targets at 104.25 and 106.68 in extension.
Comment: MACD is in the negative territory and Pair below its 20MA & 55MA.
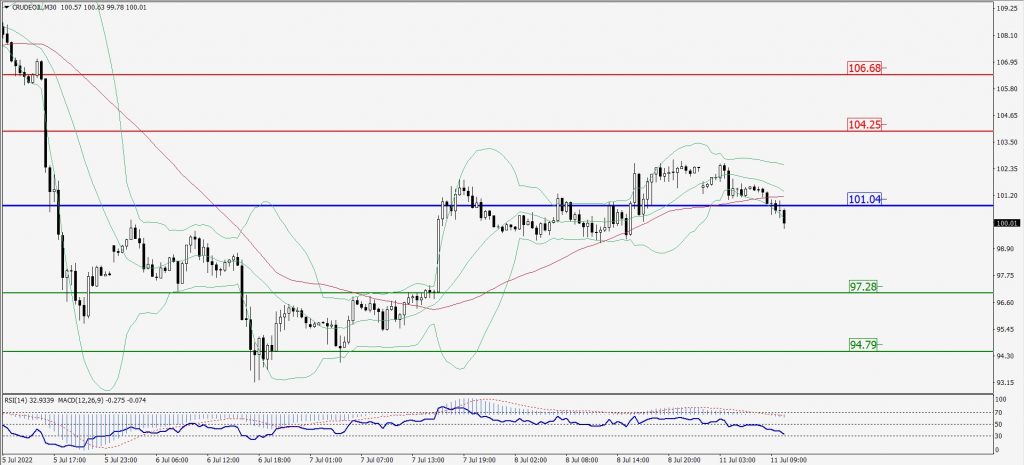
Green Lines Indicate Resistance Levels – Red Lines Indicate Support Levels
Light Blue is a Pivot Point – Black represents the price when the report was produced
XAU/USD Intraday: Trend on the downside
Our pivot point is 1747.80
Preferable Price Action: Further downside to 1720.10 and 1698.60
Alternative Price Action: If the price gives an upside breakout of a pivot, then the price extends to 1775.90 and 1795.40.
Comment: MACD is negative territory and Pairs below its 20MA & 55MA.
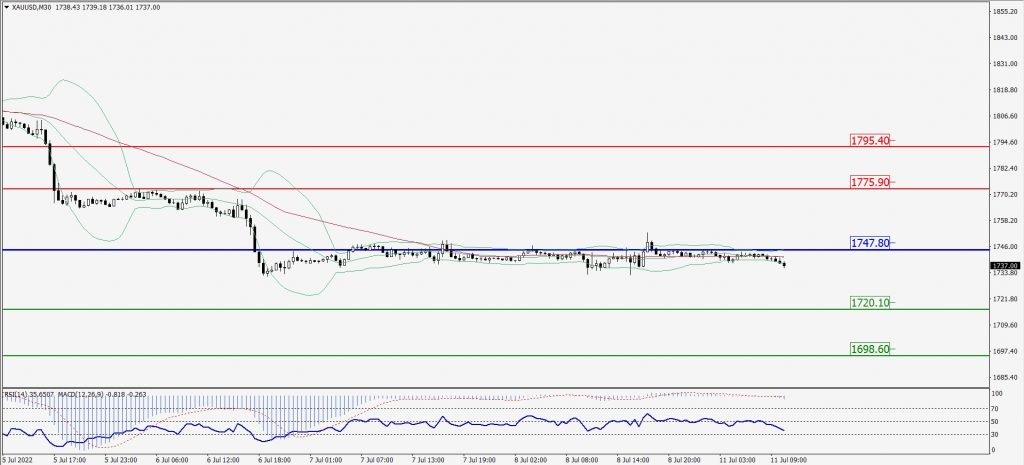
Green Lines Indicate Resistance Levels – Red Lines Indicate Support Levels
Light Blue is a Pivot Point – Black represents the price when the report was produced
Dow Jones Intraday: Trend on the downside
Our pivot point is 31,338.00
Preferable Price Action: Take sell positions below pivot with targets at 30,789.00 & 30,400.00.
Alternative Price Action: Above 31,338.00 looks for further upside to 31,827.00 & 32,264.00.
Comment: RSI below 50 levels and Pair below its 20MA & 55MA.
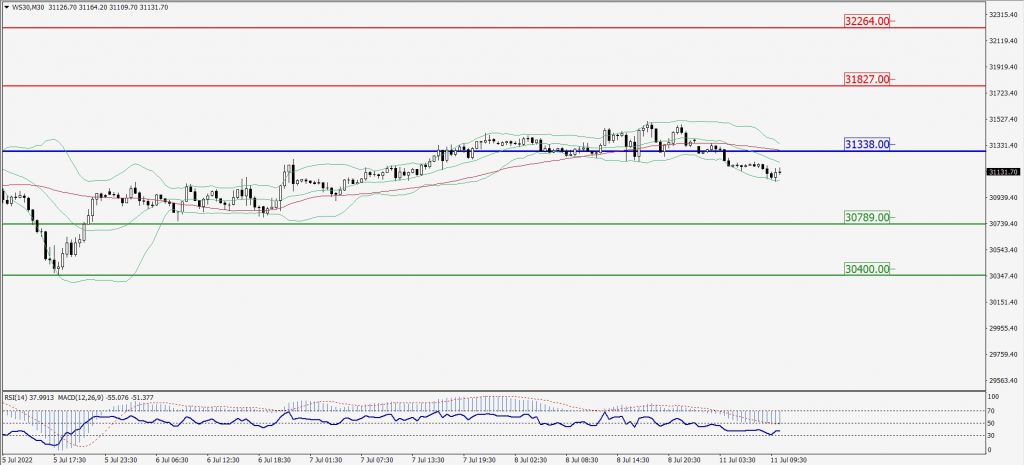
Green Lines Indicate Resistance Levels – Red Lines Indicate Support Levels
Light Blue is a Pivot Point – Black represents the price when the report was produced