Market Wrap: Stocks, Bonds, Commodities
Wall Street benchmarks ended up on Thursday, with the S&P 500 and Nasdaq recording their fourth successive higher closes, as traders leaned in to US equities after the Federal Reserve hinted at a more tempered program of interest rate hikes.
The Dow Jones Industrial Average rose 346.87 points to 31,384.55, the S&P 500 gain 57.54 points to 3,902.62 and the Nasdaq Composite add 259.49 points to 11,621.35.
MSCI’s index of Asia-Pacific stocks outside Japan is ascend 0.44% to 652.51 levels. Australian index higher 0.45% to 6,678.00. Japanese Nikkei Index ascend 0.10% to 26,517.19.
European stocks were negative on Friday, with the Stoxx Europe 50 Index fell 0.17% to 3,482.55, Germany’s DAX decline 0.05% to 12,841.58, and France’s CAC drop 0.06% to 6,009.54, and U.K.’s FTSE 100 surge 0.24% to 7,206.05.
Benchmark 10-year U.S. Treasury fell as demand for safe assets ascend again, today 10-year bond yields a negative 0.75% to 2.9850.
Oil prices slipped in early Asian trade on Friday, following a rebound in the previous session, as investors remained torn between worries over tight global supplies and fears a recession could dampen oil demand.
Spot Brent crude oil subtracts 0.22% to $104.59 per barrel. US West Texas Intermediate crude is down 0.42% to $102.28 a barrel.
The yellow metal gold is decline 0.29% to 1,734.90 dollars per ounce.
Market Wrap: Forex
The U.S. dollar edged lower in early European trade Friday, with the safe-haven Japanese yen seeing strong demand in the wake of the shooting of former Japanese Prime Minister Shinzo Abe.
Today, the U.S. dollar index measures the Greenback against a trade-weighted basket of six major currencies, which is rose 0.39% to 107.368.
The Euro US Dollar (EUR/USD) is a widely traded pair that is down 0.49% today. This left the pair trading around $1.01090.
The Japanese yen was positive against the U.S. dollar on Friday as the stock up. Today USD/JPY is drop 0.12% to 135.810 level.
Another commodity-related currency negative against the U.S dollar, AUD/USD lose 0.29% to 0.68170, and NZD/USD down 0.32 to 0.61560 level.
EUR/USD Intraday: Resistance level at 1.01890
Our pivot point is at 1.01890
Preferable Price Action: Take sell positions below pivot level with targets at 1.00480 & 0.99490 in extension.
Alternative Price Action: Above pivot looks for a further upside to 1.03280 & 1.04240.
Comment: RSI below 50 levels and Pair below its 20MA & 55MA.
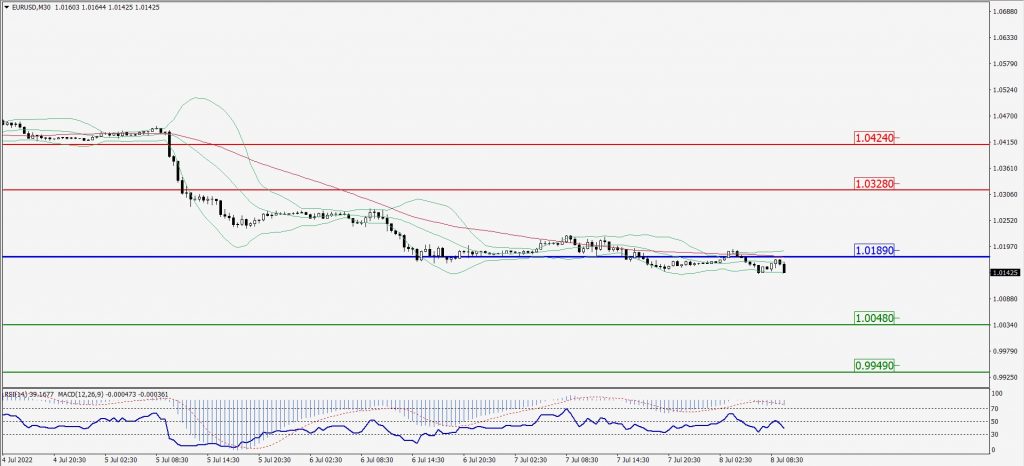
Green Lines Indicate Resistance Levels – Red Lines Indicate Support Levels
Light Blue is a Pivot Point – Black represents the price when the report was produced
GBP/USD Intraday: Trend on the downside
Our pivot point is at 1.20430
Preferable Price Action: Sell positions below pivot with targets at 1.18960 & 1.17860 in extension.
Alternative Price Action: The price above pivot would call for further upside to 1.21650 & 1.22710.
Comment: RSI below 50 levels pair below 20MA.
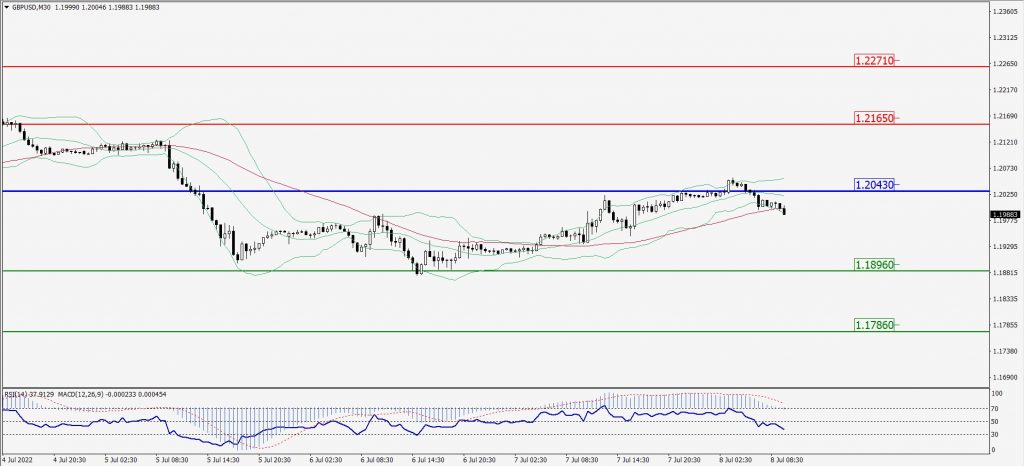
Green Lines Indicate Resistance Levels – Red Lines Indicate Support Levels
Light Blue is a Pivot Point – Black represents the price when the report was produced
USD/JPY Intraday: Support level at 135.720
Our pivot point is at 135.720
Preferable Price Action: Buy position above pivot with the target at 136.580 and 137.200 in extension.
Alternative Price Action: The downside breakout of the pivot would call for 134.860 and 134.250.
Comment: MACD is positive territory.
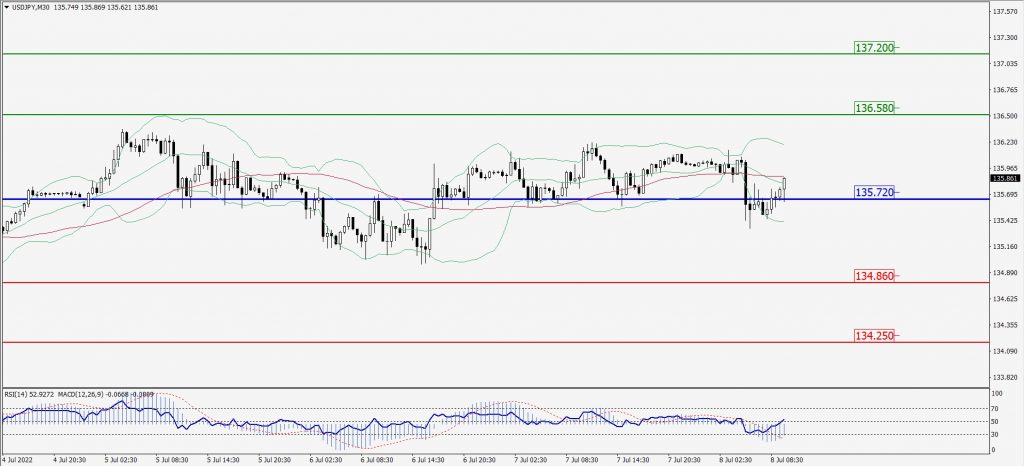
Green Lines Indicate Resistance Levels – Red Lines Indicate Support Levels
Light Blue is a Pivot Point – Black represents the price when the report was produced
AUD/USD Intraday: Trend on the downside
Our pivot point is at 0.67920
Preferable Price Action: Sell Positions below pivot with targets at 0.67690 & 0.67140 in extension.
Alternative Price Action: Above pivot looks for a further upside with 0.69350 & 0.69990 as targets.
Comment: RSI below 50 levels and Pair below its 20MA & 55MA.
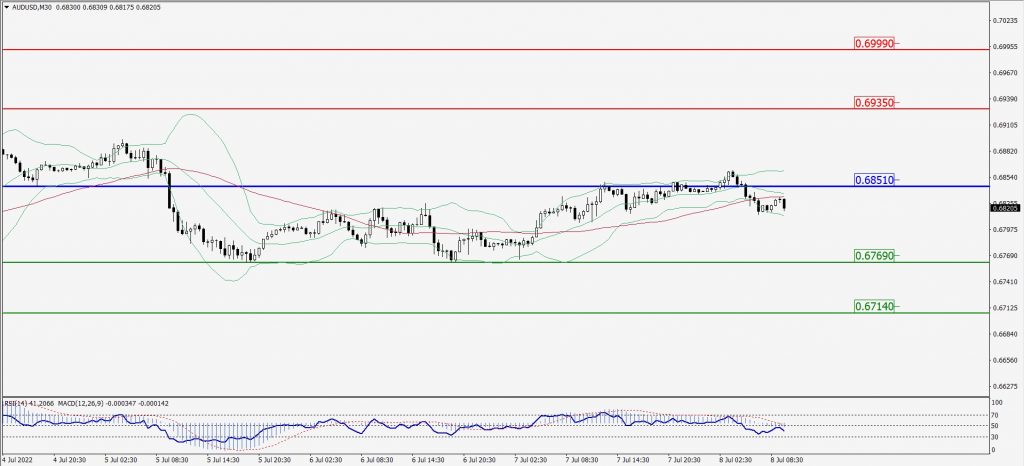
Green Lines Indicate Resistance Levels – Red Lines Indicate Support Levels
Light Blue is a Pivot Point – Black represents the price when the report was produced
CRUDEOIL Intraday: In a consolidation zone
Our pivot point is at 98.91
Preferable Price Action: Above pivots buy oil with 103.34 & 106.03 as targets.
Alternative Price Action: Sell crude below pivot with targets at 95.15 and 92.39 in extension.
Comment: MACD is in the flat territory and Pair above 55MA.
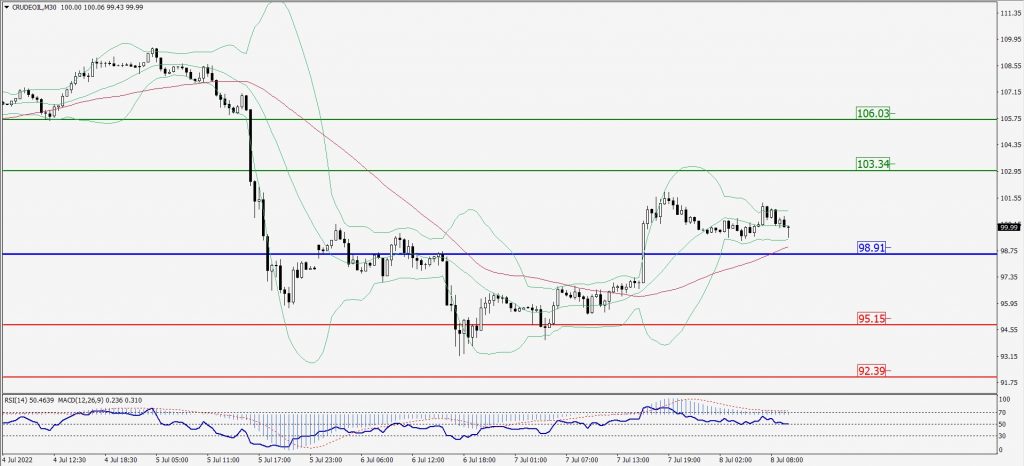
Green Lines Indicate Resistance Levels – Red Lines Indicate Support Levels
Light Blue is a Pivot Point – Black represents the price when the report was produced
XAU/USD Intraday: Trend on the downside
Our pivot point is 1751.00
Preferable Price Action: Further downside to 1720.00 and 1698.60
Alternative Price Action: If the price gives an upside breakout of a pivot, then the price extends to 1776.00 and 1795.40.
Comment: MACD is negative territory.
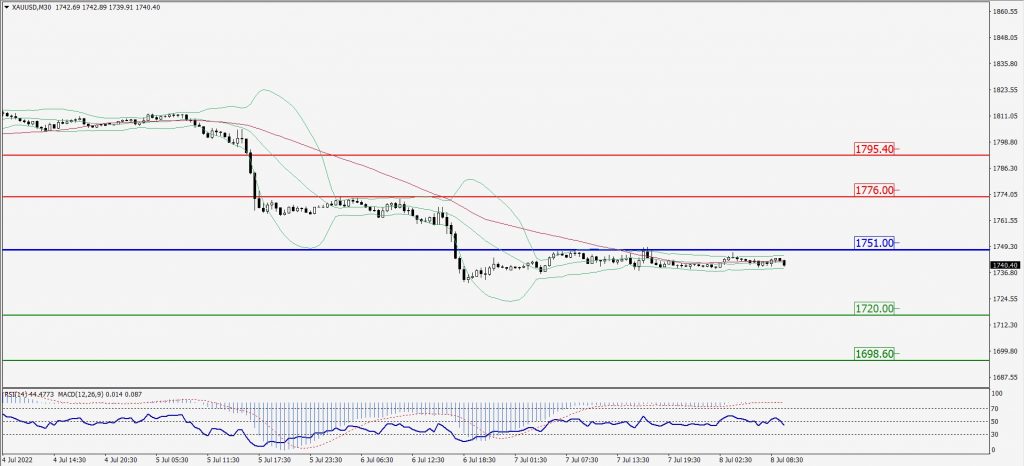
Green Lines Indicate Resistance Levels – Red Lines Indicate Support Levels
Light Blue is a Pivot Point – Black represents the price when the report was produced
Dow Jones Intraday: Trend on the upside
Our pivot point is 31,230.00
Preferable Price Action: Take buy positions above pivot with targets at 31,857.00 & 32,266.00.
Alternative Price Action: Below 31,230.00 looks for further downside to 30,746.00 & 30,395.00.
Comment: RSI above 50 levels and Pair above 55MA.
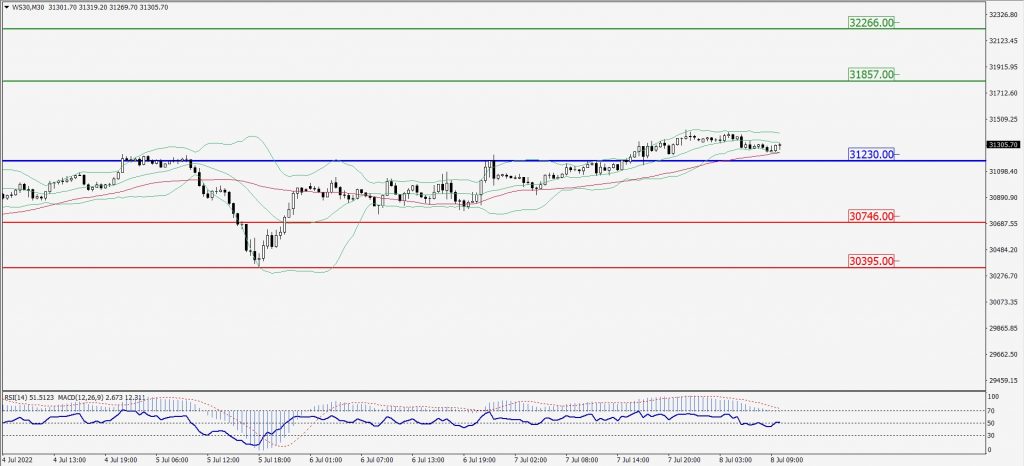
Green Lines Indicate Resistance Levels – Red Lines Indicate Support Levels
Light Blue is a Pivot Point – Black represents the price when the report was produced