Market Wrap: Stocks, Bonds, Commodities
US stock futures inched up on Thursday night as traders mulled over the July consumer inflation report and looked ahead to wholesale prices data.
The Dow Jones Industrial Average rose 52.79 points to 35,176.15, the S&P 500 gain 0.03% to 4,468.83 and the Nasdaq Composite add 15.97 points to 13,737.99.
MSCI’s index of Asia-Pacific stocks outside Japan is decline 0.92% to 635.21 levels. The Australian index was lower by 0.24% to 7,340.10. Japanese Nikkei Index ascend 0.84% today.
European stocks were positive on Friday, with the Stoxx Europe 50 Index fell 0.88% to 4,345.65, Germany’s DAX drop 0.55% to 15,910.24, and France’s CAC decline 0.78% to 7,375.57 and U.K.’s FTSE 100 subtract 0.90% to 7,550.34.
Benchmark 10-year U.S. Treasury fell as demand for safe assets ascend again, today 10-year bond yields positive 0.17% to 4.0920.
Oil prices fell slightly on Friday, with Brent crude holding close to January highs, as speculation about another US interest rate hike faded following inflation data and OPEC remained positive on the oil demand outlook.
Spot Brent crude oil drop 0.23% to $86.19 per barrel. US West Texas Intermediate crude is down 0.18% to $82.67 a barrel.
The yellow metal gold is advance 0.12% to 1,951.20 dollars per ounce.
Market Wrap: Forex
The U.S. dollar steadied in early European trade Friday in the wake of the latest consumer inflation release, while sterling bounced after stronger-than-expected U.K. growth data.
Today, the U.S. dollar index measures the Greenback against a trade-weighted basket of six major currencies, which slipped 0.02% to 102.350.
The Euro US Dollar (EUR/USD) is a widely traded pair that is up 0.15% today. This left the pair trading around $1.09970.
The Japanese yen was negative against the U.S. dollar on Friday. Today USD/JPY is slipped 0.09% to the 144.620 level.
Another commodity-related currency mixed against the U.S dollar, AUD/USD rose 0.21% to 0.65270, and NZD/USD slipped 0.10% to 0.60140 level.
EUR/USD Intraday: In a consolidation zone
Our pivot point is at 1.09820
Preferable Price Action: Take buy positions above pivot level with targets at 1.10240 & 1.10510 in extension.
Alternative Price Action: Below pivot looks for a further downside to 1.09470 & 1.09240.
Comment: RSI is at 50 levels and Pairs above 20MA.
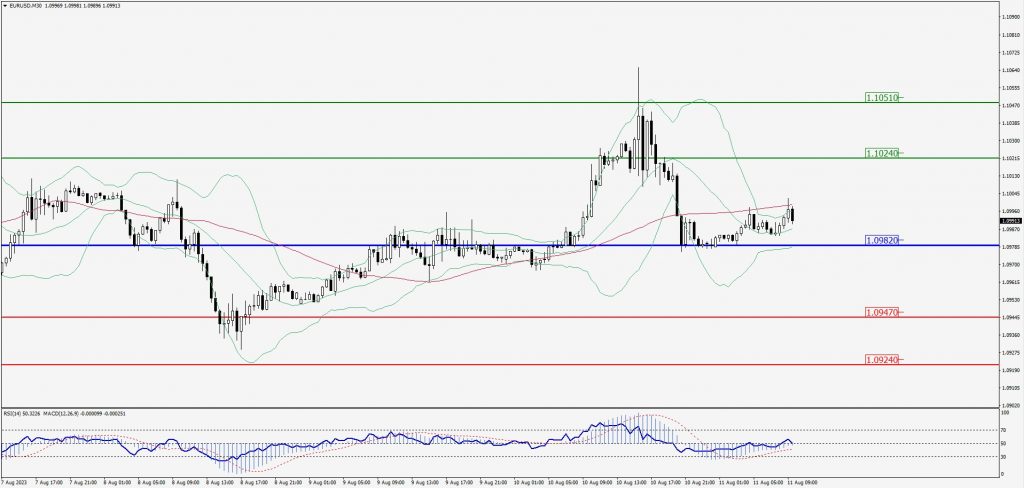
Green Lines Indicate Resistance Levels – Red Lines Indicate Support Levels
Light Blue is a Pivot Point – Black represents the price when the report was produced
GBP/USD Intraday: Trend on the upside
Our pivot point is at 1.26900
Preferable Price Action: Buy positions above pivot with targets at 1.27260 & 1.27550 in extension.
Alternative Price Action: The price below pivot would call for further downside to 1.26580 & 1.26360.
Comment: RSI is above 50 levels and Pairs above 20MA.
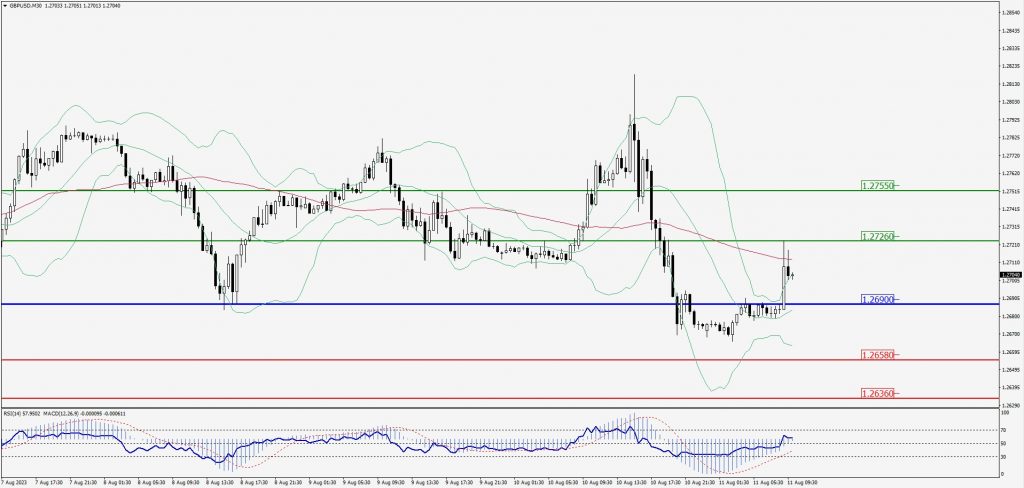
Green Lines Indicate Resistance Levels – Red Lines Indicate Support Levels
Light Blue is a Pivot Point – Black represents the price when the report was produced
USD/JPY Intraday: Major trend on the upside
Our pivot point is at 144.630
Preferable Price Action: Buy position above pivot with the target at 145.050 and 145.330 in extension.
Alternative Price Action: The downside breakout of the pivot would call for 144.240 and 143.950.
Comment: MACD is above 50 level and Pairs above 55MA.
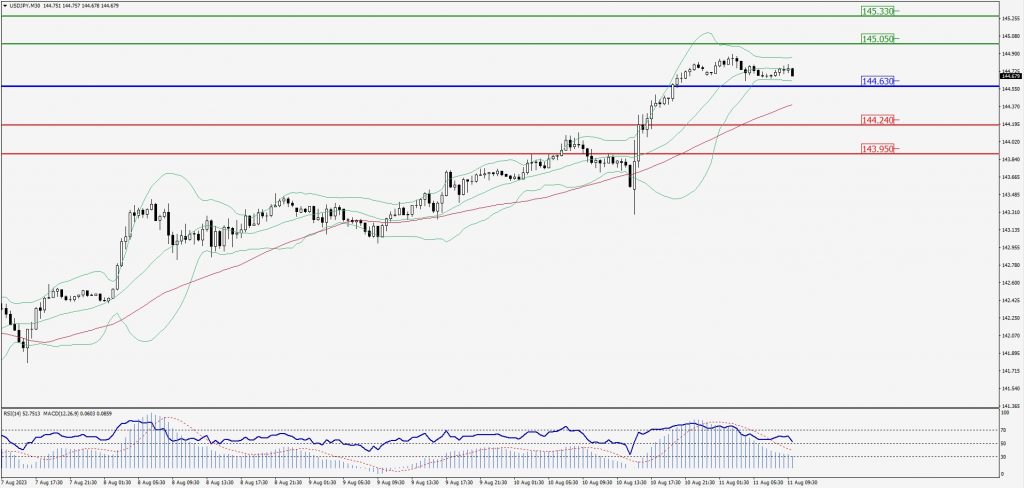
Green Lines Indicate Resistance Levels – Red Lines Indicate Support Levels
Light Blue is a Pivot Point – Black represents the price when the report was produced
AUD/USD Intraday: Resistance level at 0.65320
Our pivot point is at 0.65320
Preferable Price Action: Sell positions below pivot with targets at 0.65070 & 0.64910 in extension.
Alternative Price Action: Above pivot looks for a further upside with 0.65540 & 0.65700 as targets.
Comment: RSI is at 50 levels and Pairs below 55MA.
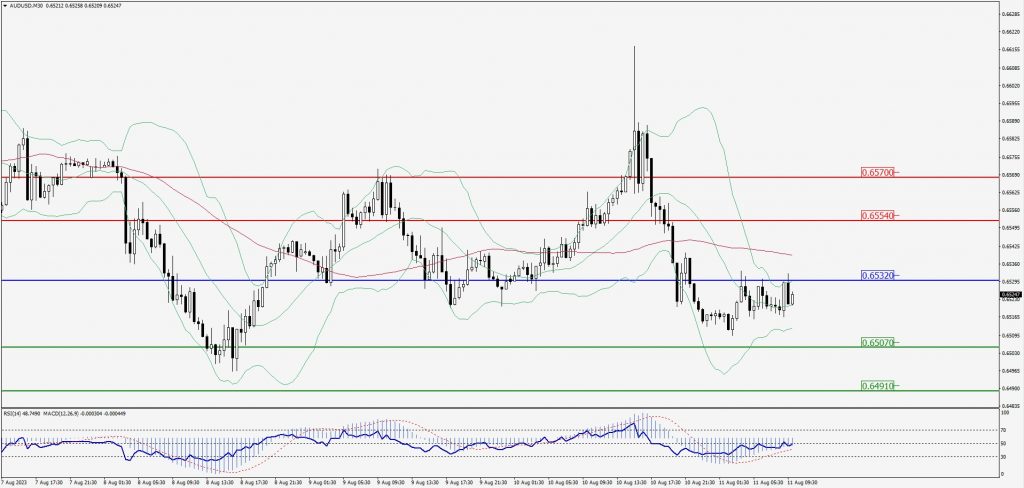
Green Lines Indicate Resistance Levels – Red Lines Indicate Support Levels
Light Blue is a Pivot Point – Black represents the price when the report was produced
CRUDEOIL Intraday: Major trend on the downside
Our pivot point is at 82.45
Preferable Price Action: Below pivot sell oil with 81.48 & 80.93 as targets.
Alternative Price Action: Buy crude above pivot with targets at 83.32 and 83.92 in extension.
Comment: MACD is negative territory and Pairs below its 20MA & 55MA.
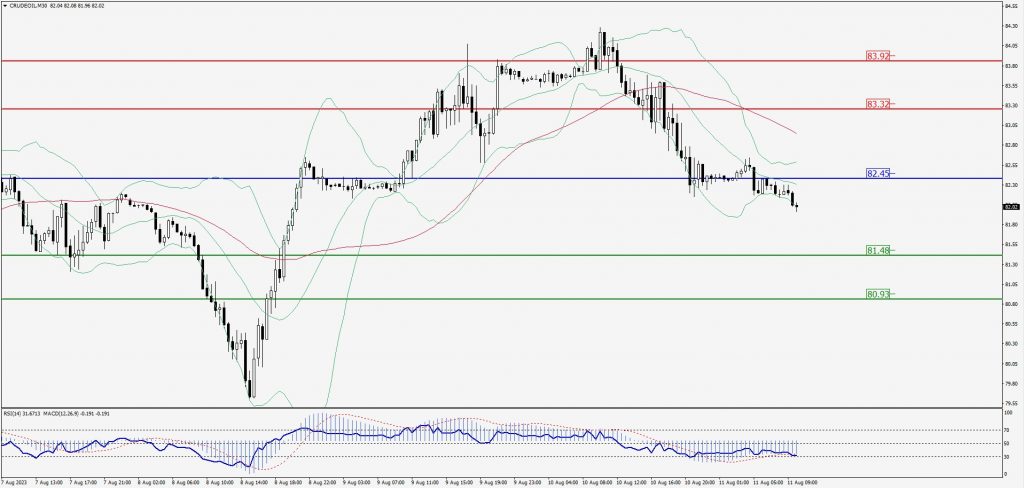
Green Lines Indicate Resistance Levels – Red Lines Indicate Support Levels
Light Blue is a Pivot Point – Black represents the price when the report was produced
XAU/USD Intraday: Trend on the upside
Our pivot point is 1914.40
Preferable Price Action: Further upside to 1921.60 and 1927.40.
Alternative Price Action: If the price gives a downside breakout of a pivot, then the price extends to 1907.60 and 1902.40.
Comment: MACD is above 50 level and Pairs above 20MA.
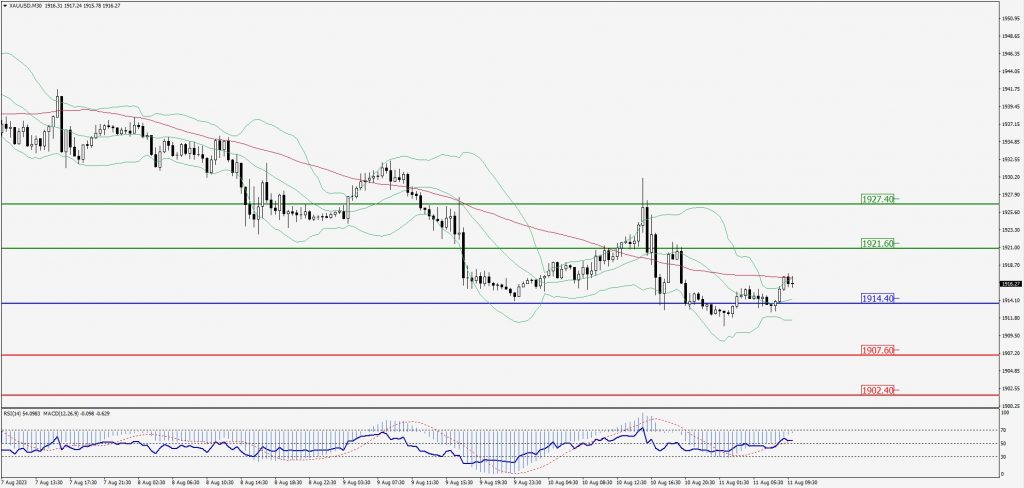
Green Lines Indicate Resistance Levels – Red Lines Indicate Support Levels
Light Blue is a Pivot Point – Black represents the price when the report was produced
Dow Jones Intraday: Trend on the upside
Our pivot point is 35,202.00
Preferable Price Action: Take buy positions above the pivot with targets at 35,314.00 & 35,395.00.
Alternative Price Action: Below 35,202.00 looks for further downside to 35,108.00 & 35,038.00.
Comment: RSI is above 50 levels and Pairs above 20MA.
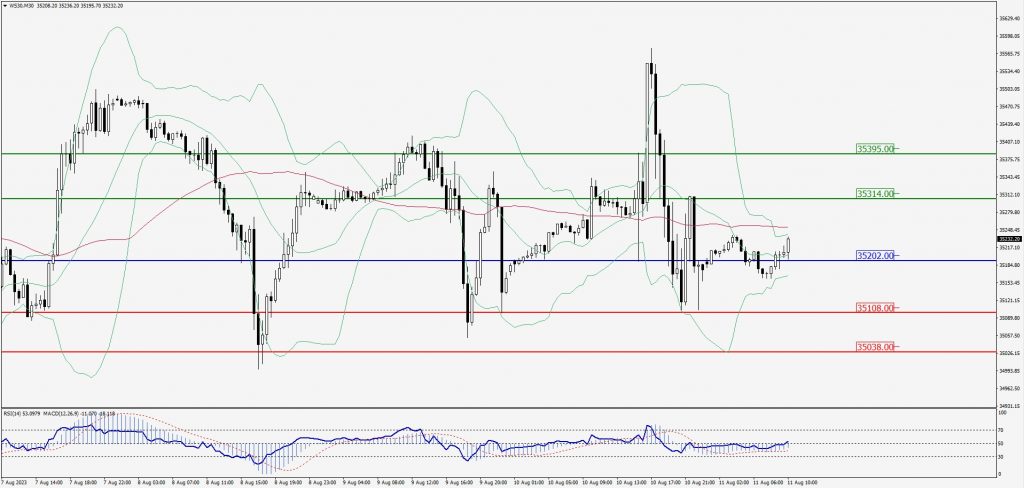
Green Lines Indicate Resistance Levels – Red Lines Indicate Support Levels
Light Blue is a Pivot Point – Black represents the price when the report was produced