Market Wrap: Stocks, Bonds, Commodities
U.S. stocks closed lower on Wednesday, the day after a report showed Americans borrowed more than ever on their credit cards in the last quarter, and a day ahead of U.S. Consumer Price Index inflation data that could influence Federal Reserve interest rate decisions.
The Dow Jones Industrial Average fell 191.13 points to 35,123.36, the S&P 500 lose 0.70% to 4,467.71 and the Nasdaq Composite subtract 162.31 points to 13,722.02.
MSCI’s index of Asia-Pacific stocks outside Japan is decline 0.18% to 641.27 levels. The Australian index was higher by 0.26% to 7,357.40. Japanese Nikkei Index ascend 0.87% today.
European stocks were positive on Thursday, with the Stoxx Europe 50 Index rose 0.94% to 4,357.95, Germany’s DAX ascend 0.52% to 15,935.85, and France’s CAC advance 0.97% to 7,392.96 and U.K.’s FTSE 100 add 0.03% to 7,589.21.
Benchmark 10-year U.S. Treasury fell as demand for safe assets ascend again, today 10-year bond yields positive 0.12% to 4.0170.
Oil prices fell slightly on Thursday, retreating from multi-month highs as traders turned cautious ahead of key U.S. inflation data due later in the day, while concerns over sluggish Chinese demand also remained in play.
Spot Brent crude oil drop 0.02% to $87.53 per barrel. US West Texas Intermediate crude is down 0.08% to $84.34 a barrel.
The yellow metal gold is advance 0.09% to 1,952.35 dollars per ounce.
Market Wrap: Forex
The U.S. dollar edged lower in early European trade Thursday ahead of a key U.S. inflation release, while the euro rebounded after weakness inspired by Italian banking woes.
Today, the U.S. dollar index measures the Greenback against a trade-weighted basket of six major currencies, which slipped 0.30% to 102.010.
The Euro US Dollar (EUR/USD) is a widely traded pair that is up 0.44% today. This left the pair trading around $1.10220.
The Japanese yen was negative against the U.S. dollar on Thursday. Today USD/JPY is surged 0.05% to the 143.800 level.
Another commodity-related currency positive against the U.S dollar, AUD/USD rose 0.43% to 0.65540, and NZD/USD surged 0.21% to 0.60640 level.
EUR/USD Intraday: Major trend on the upside
Our pivot point is at 1.09940
Preferable Price Action: Take buy positions above pivot level with targets at 1.10340 & 1.10600 in extension.
Alternative Price Action: Below pivot looks for a further downside to 1.09600 & 1.09360.
Comment: RSI is above 50 levels and Pairs above its 20MA & 55MA.
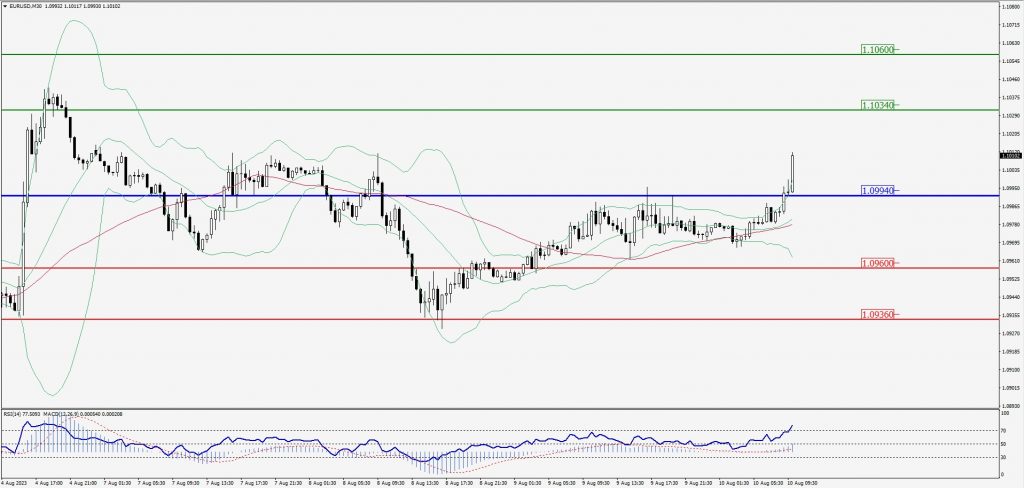
Green Lines Indicate Resistance Levels – Red Lines Indicate Support Levels
Light Blue is a Pivot Point – Black represents the price when the report was produced
GBP/USD Intraday: Support level at 1.27340
Our pivot point is at 1.27340
Preferable Price Action: Buy positions above pivot with targets at 1.27660 & 1.27880 in extension.
Alternative Price Action: The price below pivot would call for further downside to 1.27060 & 1.26870.
Comment: RSI is above 50 levels and Pairs above its 20MA & 55MA.
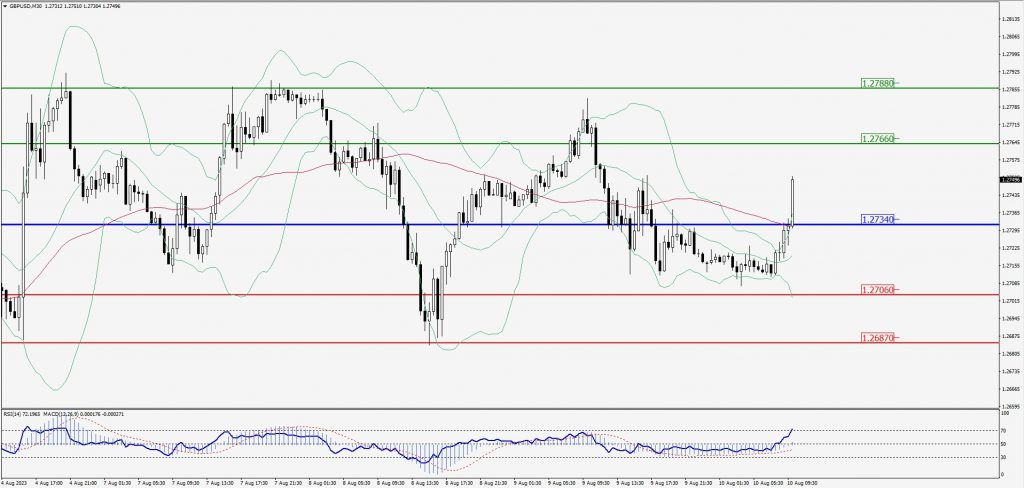
Green Lines Indicate Resistance Levels – Red Lines Indicate Support Levels
Light Blue is a Pivot Point – Black represents the price when the report was produced
USD/JPY Intraday: Trend on the upside
Our pivot point is at 143.760
Preferable Price Action: Buy position above pivot with the target at 144.250 and 144.600 in extension.
Alternative Price Action: The downside breakout of the pivot would call for 143.280 and 142.940.
Comment: MACD is above 50 level and Pairs above 55MA.
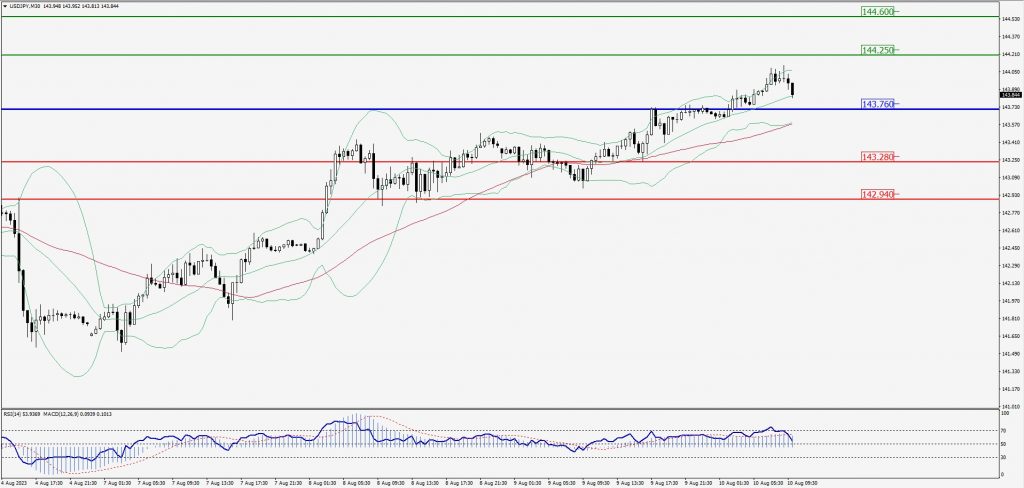
Green Lines Indicate Resistance Levels – Red Lines Indicate Support Levels
Light Blue is a Pivot Point – Black represents the price when the report was produced
AUD/USD Intraday: Trend on the upside
Our pivot point is at 0.65530
Preferable Price Action: Buy positions above pivot with targets at 0.65860 & 0.66070 in extension.
Alternative Price Action: Below pivot looks for a further downside with 0.65270 & 0.65080 as targets.
Comment: RSI is above 50 levels and Pairs above its 20MA & 55MA.
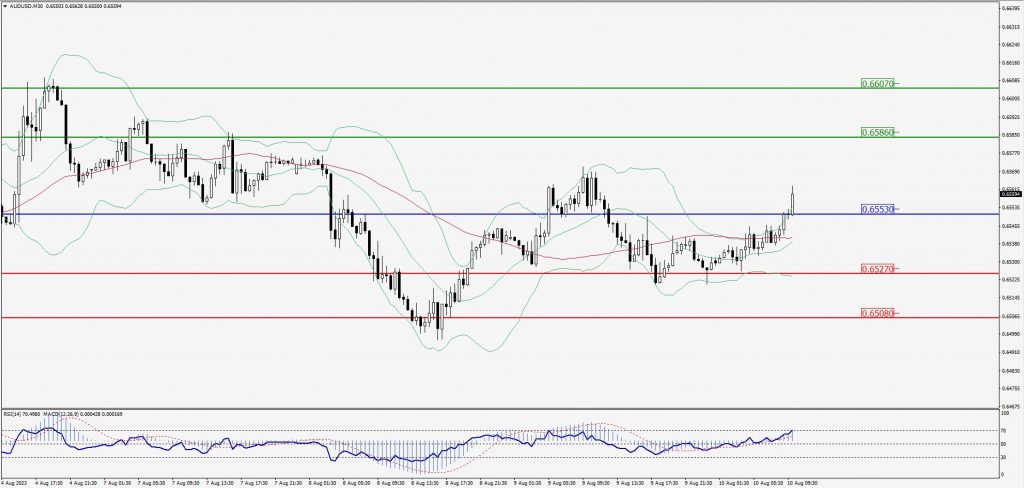
Green Lines Indicate Resistance Levels – Red Lines Indicate Support Levels
Light Blue is a Pivot Point – Black represents the price when the report was produced
CRUDEOIL Intraday: Support level at 83.68
Our pivot point is at 83.68
Preferable Price Action: Above pivot buy oil with 85.08 & 85.86 as targets.
Alternative Price Action: Sell crude below pivot with targets at 82.62 and 81.87 in extension.
Comment: MACD is positive territory and Pairs above 55MA.
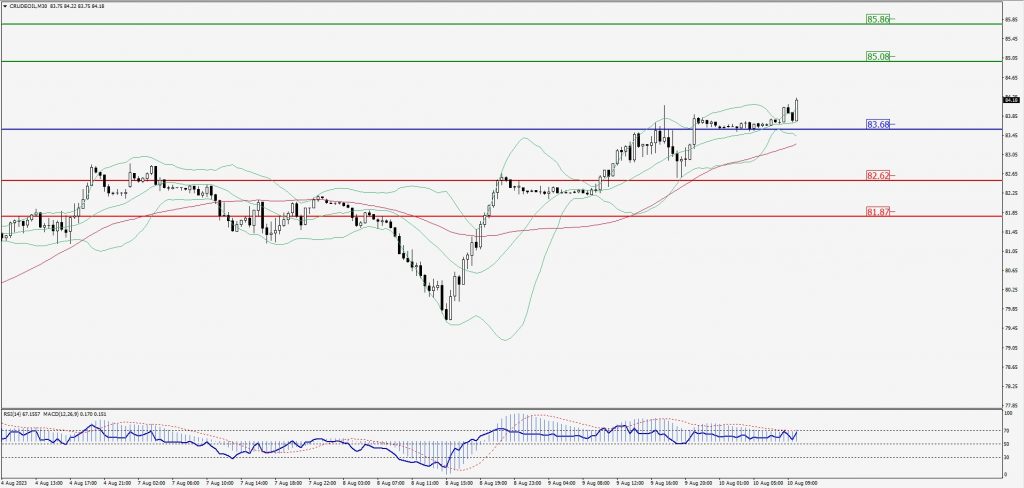
Green Lines Indicate Resistance Levels – Red Lines Indicate Support Levels
Light Blue is a Pivot Point – Black represents the price when the report was produced
XAU/USD Intraday: Support level at 1917.80
Our pivot point is 1917.80
Preferable Price Action: Further upside to 1925.10 and 1929.60.
Alternative Price Action: If the price gives a downside breakout of a pivot, then the price extends to 1911.50 and 1907.30.
Comment: MACD is above 50 level and Pairs above 20MA.
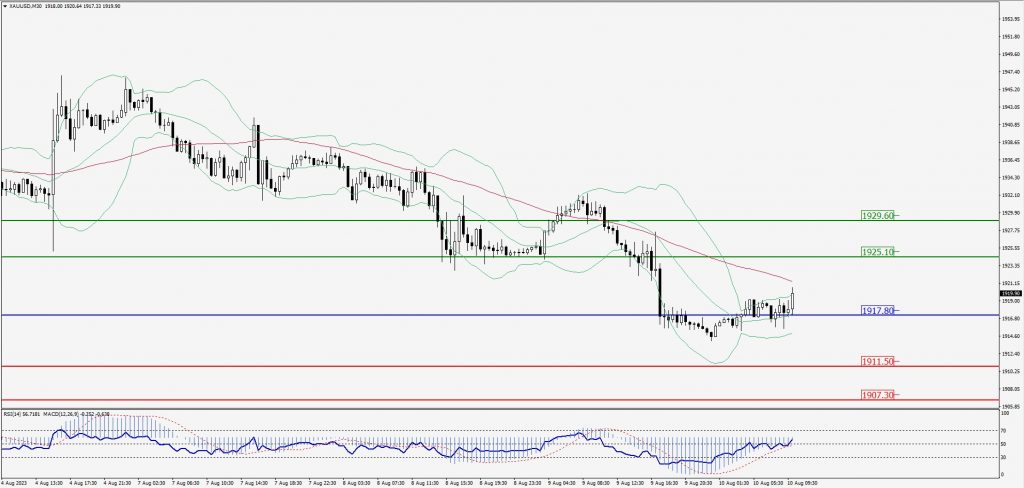
Green Lines Indicate Resistance Levels – Red Lines Indicate Support Levels
Light Blue is a Pivot Point – Black represents the price when the report was produced
Dow Jones Intraday: Trend on the upside
Our pivot point is 35,294.00
Preferable Price Action: Take buy positions above the pivot with targets at 35,433.00 & 35,546.00.
Alternative Price Action: Below 35,294.00 looks for further downside to 35,170.00 & 35,068.00.
Comment: RSI is above 50 levels and Pairs above its 20MA & 55MA.
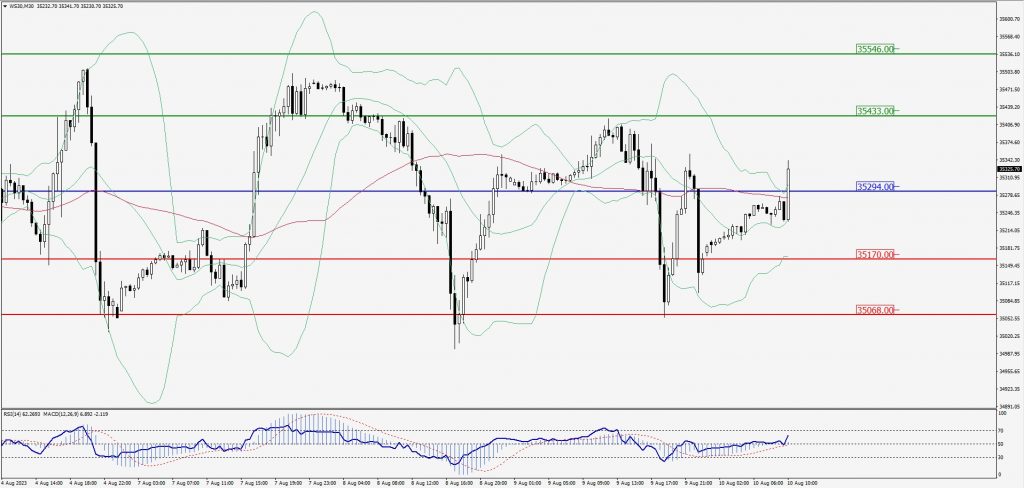
Green Lines Indicate Resistance Levels – Red Lines Indicate Support Levels
Light Blue is a Pivot Point – Black represents the price when the report was produced