Market Wrap: Stocks, Bonds, Commodities
The S&P 500 hit a one-month high as US jobless claims rose, fueling speculation of Fed rate cuts. The bond rally continued following a successful $25 billion 30-year debt sale.
The Dow Jones Industrial Average rose 331.37 points to 39,387.76, the S&P 500 gain 0.51% to 5,214.08 and the Nasdaq Composite surged 43.51 points to 16,346.27.
MSCI’s index of Asia-Pacific stocks outside Japan is surged 1.05% to 681.05 levels. The Australian index was high by 0.35% to 7,749.00. Japanese Nikkei Index surged 0.49% today.
European stocks were positive on Friday, with the Stoxx Europe 50 Index increase 0.68% to 5,088.65, Germany’s DAX surged 0.79% to 18,826.85, and France’s CAC higher 0.69% to 8,243.99 and U.K.’s FTSE 100 gain 0.60% to 8,431.32.
Benchmark 10-year U.S. Treasury rose as demand for safe assets slipped again, today 10-year bond yields either up or down 0.02% to 4.4500.
Oil poised for third consecutive day of gains, boosting weekly performance on US jobs data hinting at Fed rate cuts, supporting risk assets.
Spot Brent crude oil surged 0.20% to $84.05 per barrel. US West Texas Intermediate crude is up 0.30% to $79.50 a barrel.
The yellow metal gold is increase 1.50% to 2,375.45 dollars per ounce.
Market Wrap: Forex
The U.S. dollar steadied Friday after losing ground the previous session on weak jobs data, while the pound gained in the wake of stronger-than-expected growth numbers.
Today, the U.S. dollar index measures the Greenback against a trade-weighted basket of six major currencies, which surged 0.01% to 105.110.
The Euro US Dollar (EUR/USD) is a widely traded pair that is either up or down 0.02% today. This left the pair trading around $1.07810.
The Japanese yen was negative against the U.S. dollar on Friday. Today USD/JPY is higher 0.14% to the 155.69 level.
Another commodity-related currency negative against the U.S dollar, AUD/USD fell 0.13% to 0.66110, and NZD/USD descend 0.28% to 0.60170 level.
EUR/USD Intraday: Trend on the downside
Our pivot point is at 1.07770
Preferable Price Action: Take sell positions below pivot level with targets at 1.07670 & 1.07590 in extension.
Alternative Price Action: Above pivot looks for a further upside to 1.07860 & 1.07930.
Comment: RSI is below 50 levels and pairs below its 20MA.
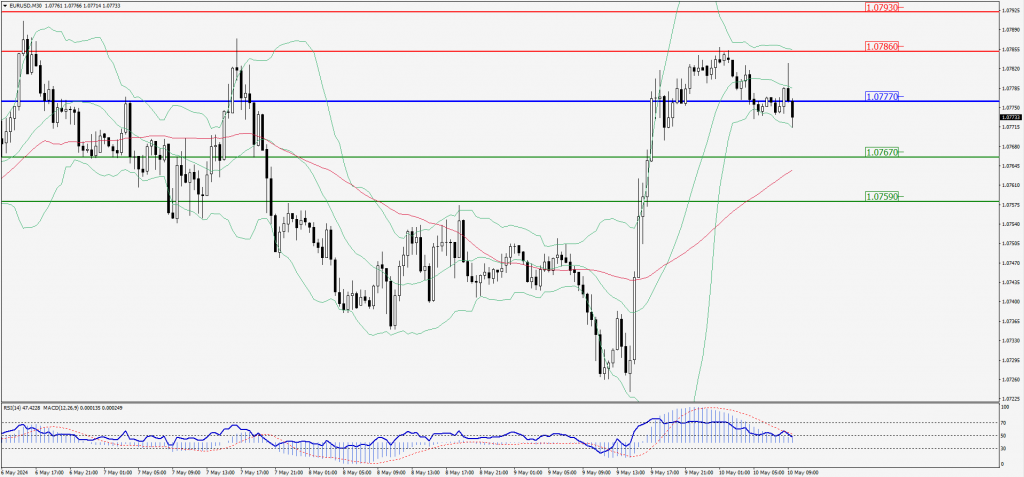
Green Lines Indicate Resistance Levels – Red Lines Indicate Support Levels
Light Blue is a Pivot Point – Black represents the price when the report was produced
GBP/USD Intraday: Trend on the upside
Our pivot point is at 1.25300
Preferable Price Action: Buy positions above pivot with targets at 1.25510 & 1.25670 in extension.
Alternative Price Action: The price below pivot would call for further downside to 1.25100 & 1.24930.
Comment: RSI is above 50 levels and pairs above its 20MA & 55MA.
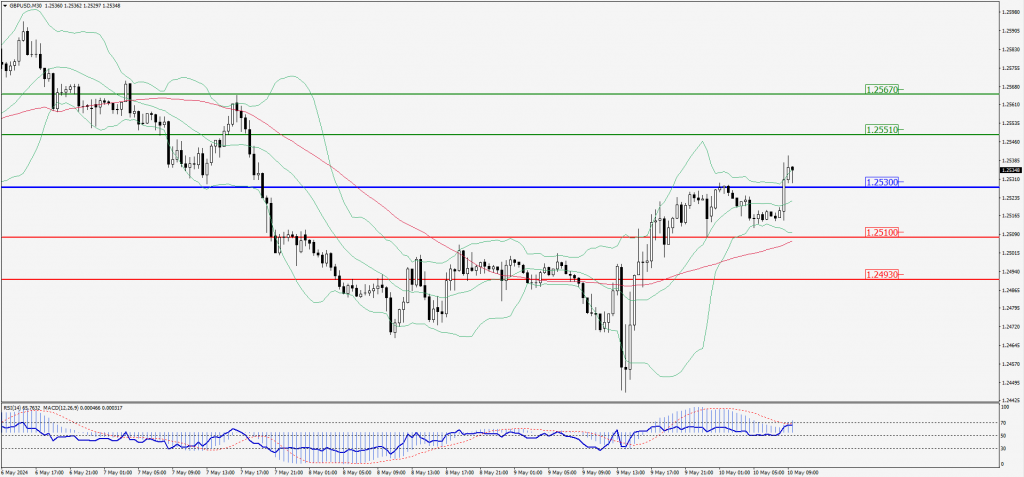
Green Lines Indicate Resistance Levels – Red Lines Indicate Support Levels
Light Blue is a Pivot Point – Black represents the price when the report was produced
USD/JPY Intraday: Trend on the upside
Our pivot point is at 155.600
Preferable Price Action: Buy position above pivot with the target at 156.230 and 156.670 in extension.
Alternative Price Action: The downside breakout of the pivot would call for 155.010 and 154.530.
Comment: MACD is above 50 levels.
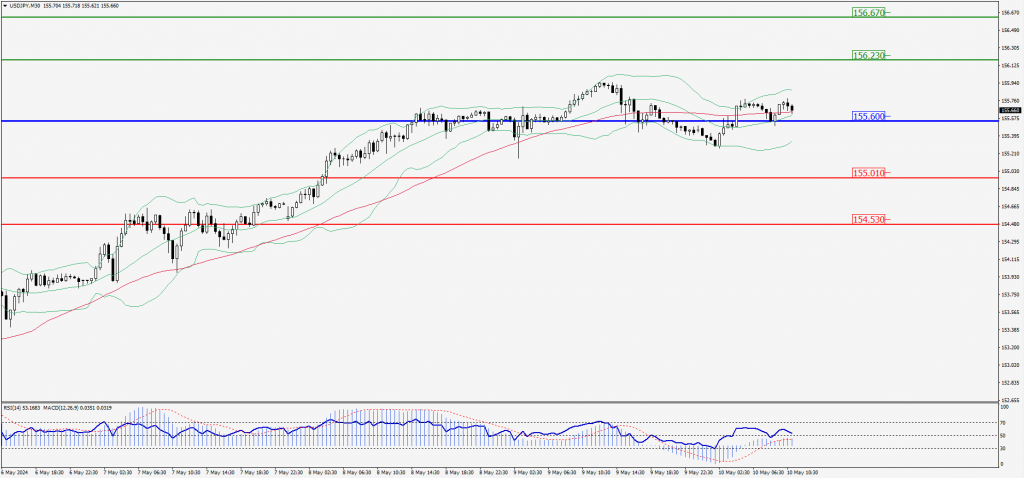
Green Lines Indicate Resistance Levels – Red Lines Indicate Support Levels
Light Blue is a Pivot Point – Black represents the price when the report was produced
AUD/USD Intraday: Support Level at 0.66110
Our pivot point is at 0.66110
Preferable Price Action: Buy positions above pivot with targets at 0.66380 & 0.66580 in extension.
Alternative Price Action: Below pivot looks for a further downside with 0.65830 & 0.65630 as targets.
Comment: RSI is above 50 levels and pairs above its 55MA.
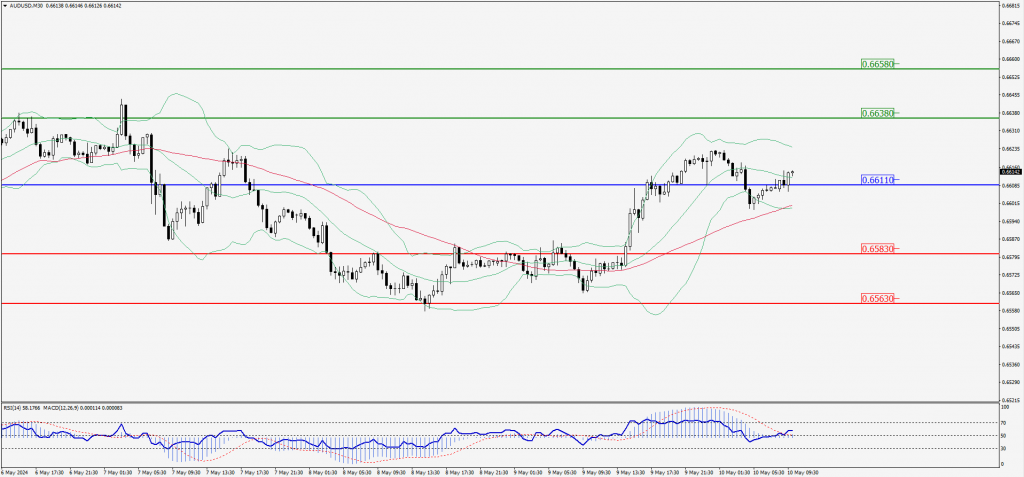
Green Lines Indicate Resistance Levels – Red Lines Indicate Support Levels
Light Blue is a Pivot Point – Black represents the price when the report was produced
CRUDEOIL Intraday: Trend on the upside
Our pivot point is at 79.39
Preferable Price Action: Above pivot buy oil with 79.91 & 80.29 as targets.
Alternative Price Action: Sell crude below pivot with targets at 78.89 and 78.45 in extension.
Comment: MACD is positive territory and Pairs above its 20MA & 55MA.
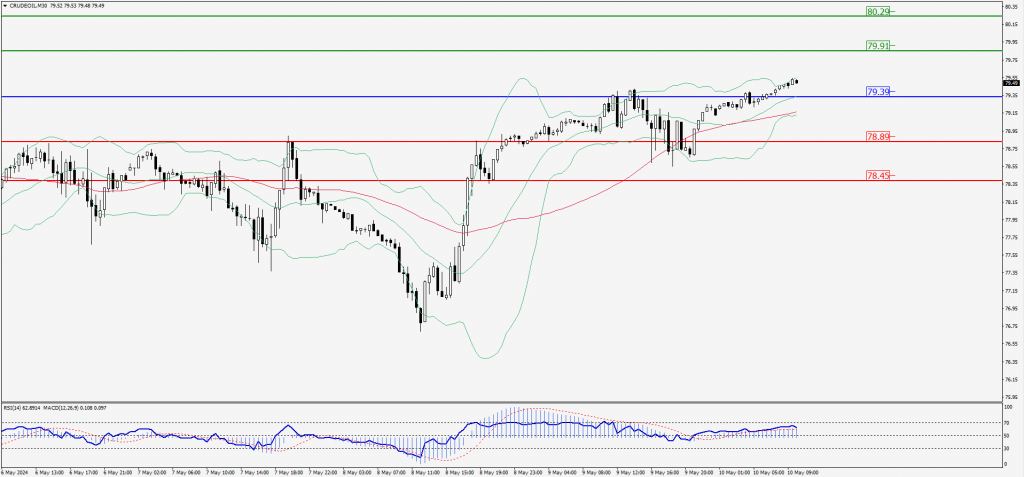
Green Lines Indicate Resistance Levels – Red Lines Indicate Support Levels
Light Blue is a Pivot Point – Black represents the price when the report was produced
XAU/USD Intraday: Major trend on the upside
Our pivot point is 2367.20
Preferable Price Action: Further upside to 2380.60 and 2389.50.
Alternative Price Action: If the price gives an downside breakout of a pivot, then the price extends to 2354.60 and 2344.20.
Comment: MACD is above 50 levels and pairs above its 20MA & 55MA.
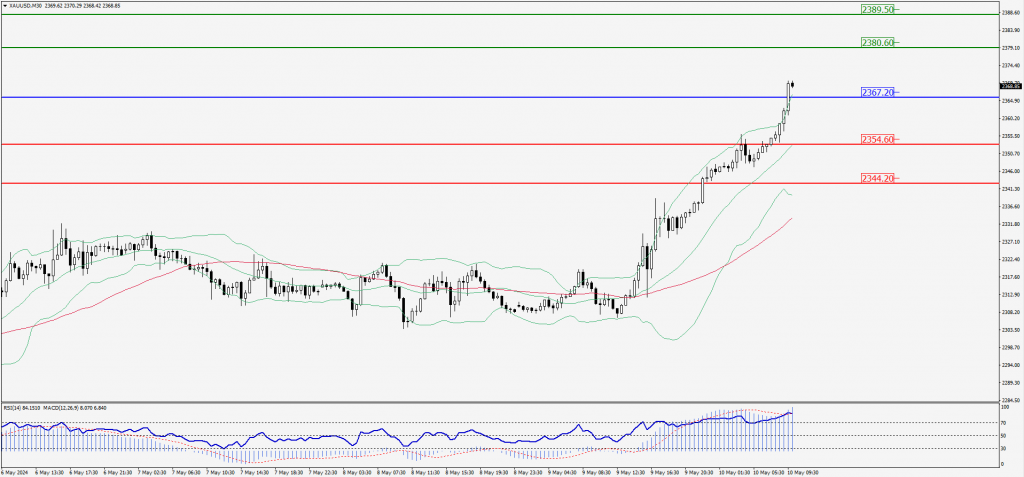
Green Lines Indicate Resistance Levels – Red Lines Indicate Support Levels
Light Blue is a Pivot Point – Black represents the price when the report was produced
Dow Jones Intraday: Major trend on the upside
Our pivot point is 39,445.30
Preferable Price Action: Take buy positions above the pivot with targets at 39,560.50 & 39,659.40.
Alternative Price Action: Above 39,445.30 looks for further downside to 39,322.10 & 39,211.80.
Comment: RSI is above 50 levels and pairs above its 20MA & 55MA.
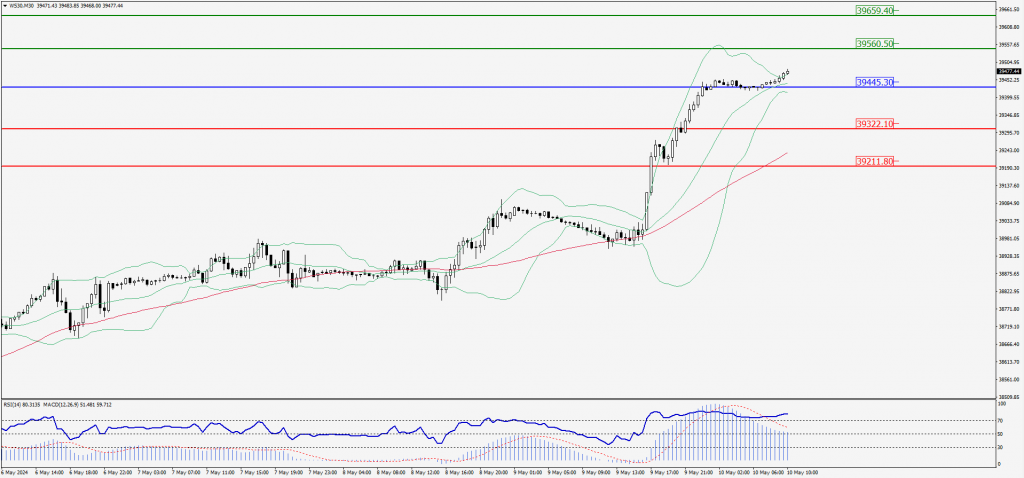
Green Lines Indicate Resistance Levels – Red Lines Indicate Support Levels
Light Blue is a Pivot Point – Black represents the price when the report was produced