Market Wrap: Stocks, Bonds, Commodities
Wall Street’s stock enthusiasm waned as traders hesitated to join a solid early May rally. The S&P 500 closed flat, staying below 5,200.
The Dow Jones Industrial Average rose 172.13 points to 39,056.39, the S&P 500 loss 0.01% to 5,187.67 and the Nasdaq Composite decline 29.80 points to 16,302.76.
MSCI’s index of Asia-Pacific stocks outside Japan is decline 0.10% to 674.44 levels. The Australian index was low by 1.06% to 7,721.60. Japanese Nikkei Index decline 0.34% today.
European stocks were mixed on Thursday, with the Stoxx Europe 50 Index decrease 0.39% to 5,018.65, Germany’s DAX surged 0.31% to 18,545.55, and France’s CAC lower 0.11% to 8,122.22 and U.K.’s FTSE 100 gain 0.09% to 8.,361.89.
Benchmark 10-year U.S. Treasury rose as demand for safe assets slipped again, today 10-year bond yields positive 0.74% to 4.5180.
Oil prices fell in early Asian trading due to reports of increased U.S. crude and fuel stockpiles, indicating weak demand. Brent crude futures dropped 0.3 percent to $82.95 a barrel, while U.S. West Texas Intermediate crude futures fell 0.2 percent to $78.25 a barrel.
Spot Brent crude oil surged 0.62% to $84.10 per barrel. US West Texas Intermediate crude is up 0.71% to $79.55 a barrel.
The yellow metal gold is decrease 0.24% to 2,316.70 dollars per ounce.
Market Wrap: Forex
The U.S. dollar edged higher Thursday, trading in a tight range ahead of next week’s all-important U.S. inflation data, while the pound slipped ahead of the Bank of England’s policy-setting meeting.
Today, the U.S. dollar index measures the Greenback against a trade-weighted basket of six major currencies, which surged 0.17% to 105.600.
The Euro US Dollar (EUR/USD) is a widely traded pair that is down 0.16% today. This left the pair trading around $1.07280.
The Japanese yen was negative against the U.S. dollar on Thursady. Today USD/JPY is higher 0.25% to the 155.88 level.
Another commodity-related currency negative against the U.S dollar, AUD/USD fell 0.03% to 0.65760, and NZD/USD descend 0.10% to 0.59980 level.
EUR/USD Intraday: Trend on the downside
Our pivot point is at 1.07450
Preferable Price Action: Take sell positions below pivot level with targets at 1.07290 & 1.07180 in extension.
Alternative Price Action: Above pivot looks for a further upside to 1.07620 & 1.07740.
Comment: RSI is below 50 levels and pairs below its 20MA & 55MA.
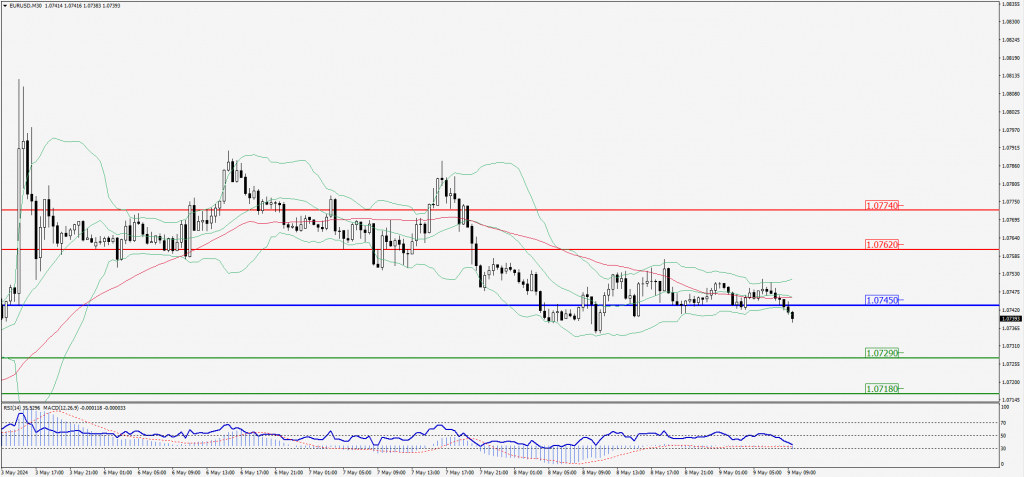
Green Lines Indicate Resistance Levels – Red Lines Indicate Support Levels
Light Blue is a Pivot Point – Black represents the price when the report was produced
GBP/USD Intraday: Resistance level at 1.24920
Our pivot point is at 1.24920
Preferable Price Action: Sell positions below pivot with targets at 1.24670 & 1.24470 in extension.
Alternative Price Action: The price above pivot would call for further upside to 1.25160 & 1.25370.
Comment: RSI is below 50 levels and pairs below its 20MA & 55MA.
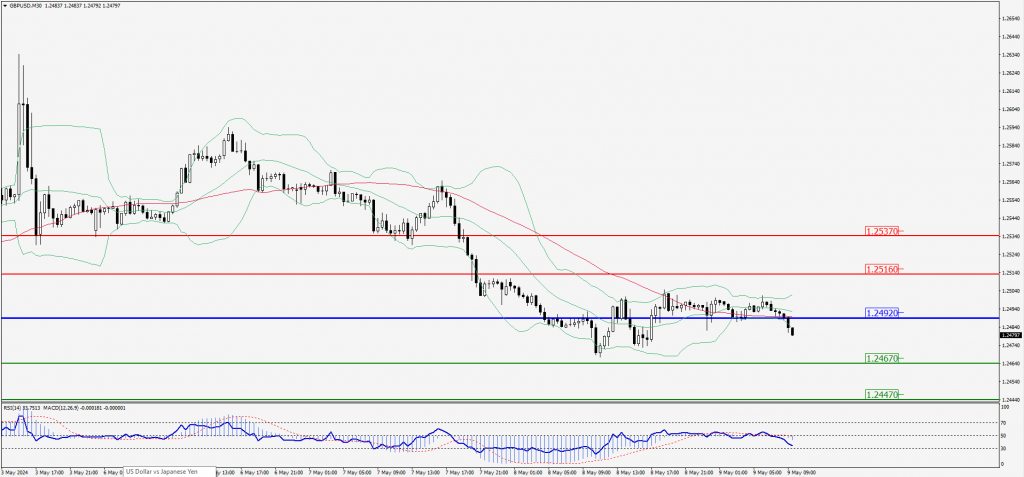
Green Lines Indicate Resistance Levels – Red Lines Indicate Support Levels
Light Blue is a Pivot Point – Black represents the price when the report was produced
USD/JPY Intraday: Trend on the upside
Our pivot point is at 155.650
Preferable Price Action: Buy position above pivot with the target at 156.250 and 156.700 in extension.
Alternative Price Action: The downside breakout of the pivot would call for 155.050 and 154.570.
Comment: MACD is above 50 levels and Pairs above its 20MA & 55MA.
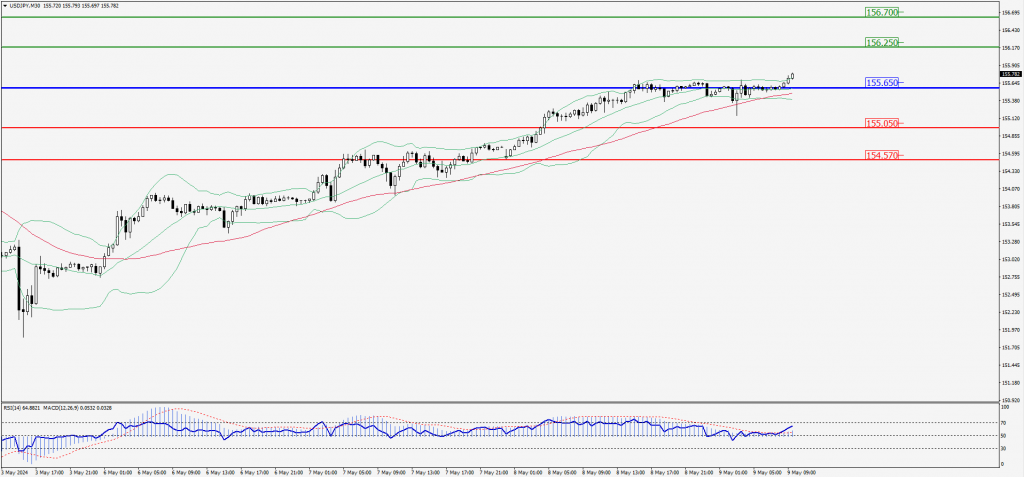
Green Lines Indicate Resistance Levels – Red Lines Indicate Support Levels
Light Blue is a Pivot Point – Black represents the price when the report was produced
AUD/USD Intraday: Trend on the downside
Our pivot point is at 0.65780
Preferable Price Action: Sell positions below pivot with targets at 0.65470 & 0.65230 in extension.
Alternative Price Action: Above pivot looks for a further upside with 0.66090 & 0.66330 as targets.
Comment: RSI is below 50 levels and pairs below its 20MA & 55MA.
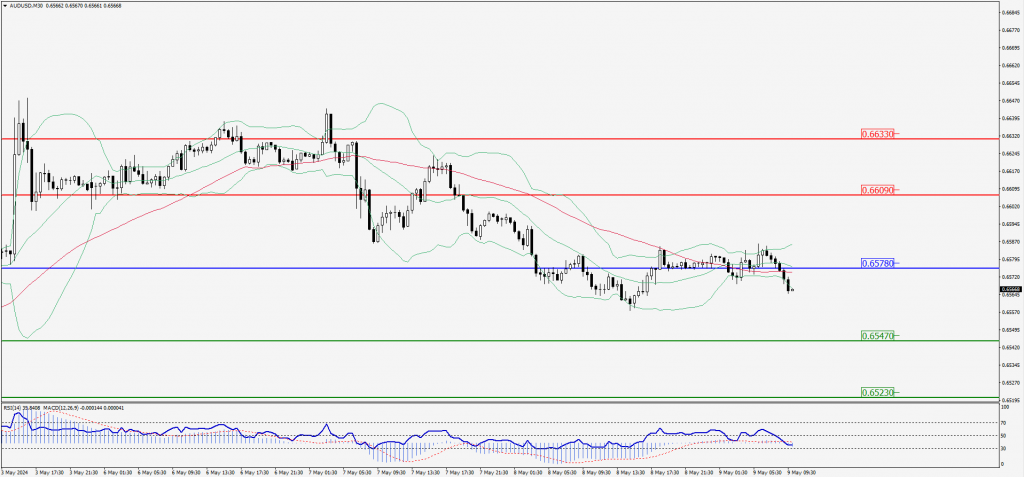
Green Lines Indicate Resistance Levels – Red Lines Indicate Support Levels
Light Blue is a Pivot Point – Black represents the price when the report was produced
CRUDEOIL Intraday: Trend on the upside
Our pivot point is at 78.82
Preferable Price Action: Above pivot buy oil with 79.48 & 79.99 as targets.
Alternative Price Action: Sell crude below pivot with targets at 78.19 and 77.69 in extension.
Comment: MACD is positive territory and Pairs above its 55MA.
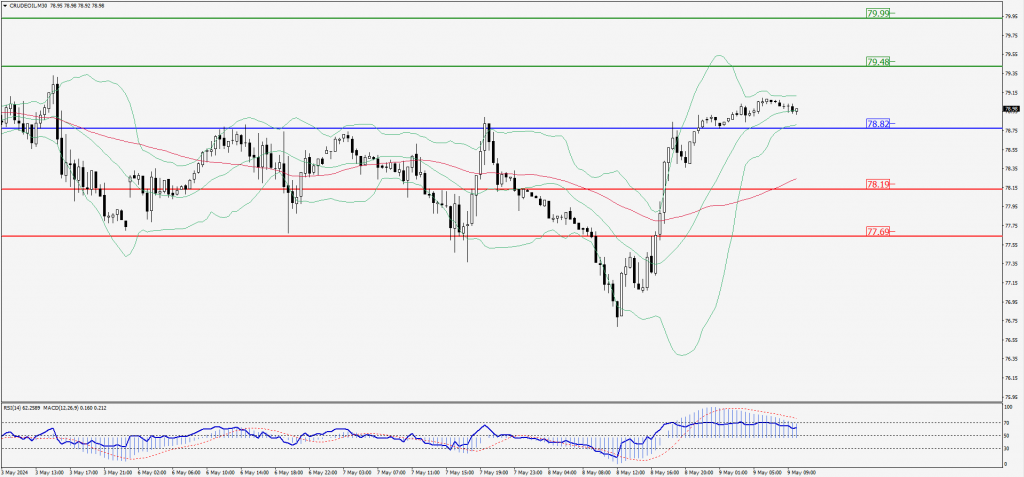
Green Lines Indicate Resistance Levels – Red Lines Indicate Support Levels
Light Blue is a Pivot Point – Black represents the price when the report was produced
XAU/USD Intraday: In a consolidation state at 2311.80
Our pivot point is 2311.80
Preferable Price Action: Further upside to 2319.90 and 2325.60.
Alternative Price Action: If the price gives an downside breakout of a pivot, then the price extends to 2304.20 and 2298.50.
Comment: MACD is at 50 levels and pairs above 20MA.
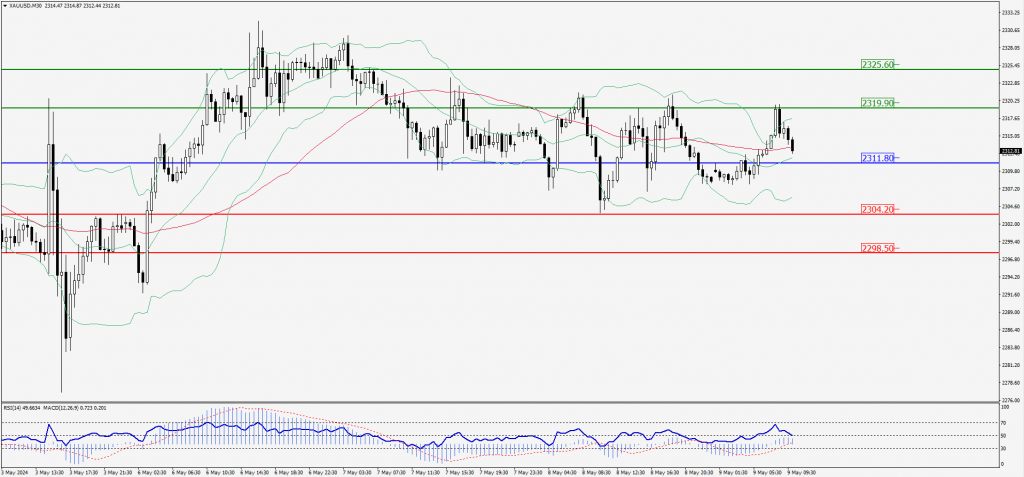
Green Lines Indicate Resistance Levels – Red Lines Indicate Support Levels
Light Blue is a Pivot Point – Black represents the price when the report was produced
Dow Jones Intraday: Trend on the downside
Our pivot point is 39,052.60
Preferable Price Action: Take sell positions below the pivot with targets at 38,941.40 & 38,865.10.
Alternative Price Action: Above 39,052.60 looks for further upside to 39,161.20 & 39,234.90.
Comment: RSI is below 50 levels and pairs below its 20MA.
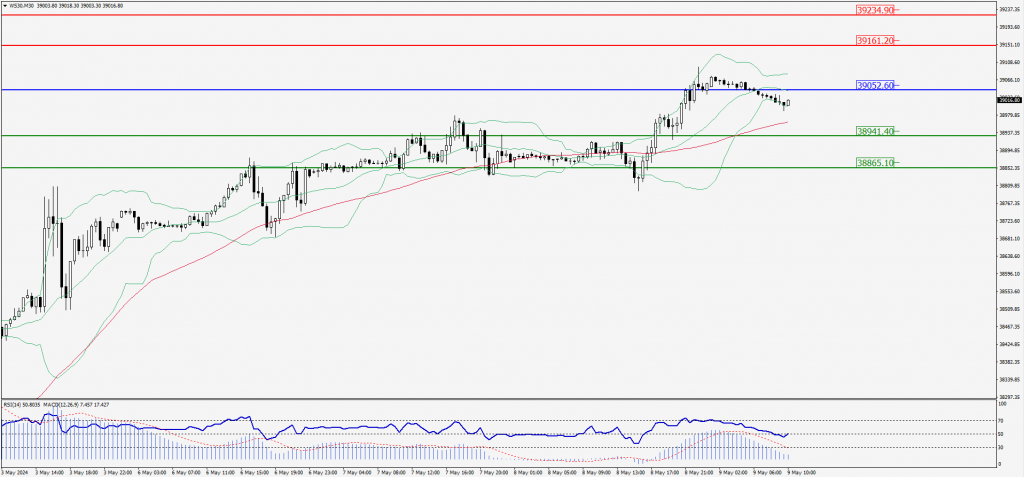
Green Lines Indicate Resistance Levels – Red Lines Indicate Support Levels
Light Blue is a Pivot Point – Black represents the price when the report was produced