Market Wrap: Stocks, Bonds, Commodities
Wall Street trimmed gains Tuesday as investors weighed potential Federal Reserve rate cuts. The dollar’s strength further weakened the yen.
The Dow Jones Industrial Average rose 31.99 points to 38,884.26, the S&P 500 gain 0.13% to 5,187.70 and the Nasdaq Composite decline 16.69 points to 16,332.55.
MSCI’s index of Asia-Pacific stocks outside Japan is decline 0.36% to 674.66 levels. The Australian index was high by 0.14% to 7,804.50. Japanese Nikkei Index decline 1.54% today.
European stocks were positive on Wednesday, with the Stoxx Europe 50 Index increase 0.47% to 5,039.65, Germany’s DAX surged 0.45% to 18,521.25, and France’s CAC higher 0.84% to 8,43.91 and U.K.’s FTSE 100 gain 0.35% to 8,342.69.
Benchmark 10-year U.S. Treasury rose as demand for safe assets slipped again, today 10-year bond yields positive 0.25% to 4.4700.
Oil steadied near its mid-March lows amid Middle East tensions and a slightly bearish US stockpiles report.
Spot Brent crude oil decline 1.41% to $81.99 per barrel. US West Texas Intermediate crude is down 1.56% to $77.16 a barrel.
The yellow metal gold is decrease 0.36% to 2,315.75 dollars per ounce.
Market Wrap: Forex
The dollar held firm on Wednesday, recouping some of the losses stemming from renewed bets on Federal Reserve rate cuts this year, while the yen weakened for a third day, keeping investors wary of the risk of intervention from Tokyo.
Today, the U.S. dollar index measures the Greenback against a trade-weighted basket of six major currencies, which surged 0.15% to 105.455.
The Euro US Dollar (EUR/USD) is a widely traded pair that is down 0.06% today. This left the pair trading around $1.07460.
The Japanese yen was negative against the U.S. dollar on Wednesday. Today USD/JPY is higher 0.48% to the 155.43 level.
Another commodity-related currency negative against the U.S dollar, AUD/USD fell 0.45% to 0.65660, and NZD/USD decend 0.25% to 0.59840 level.
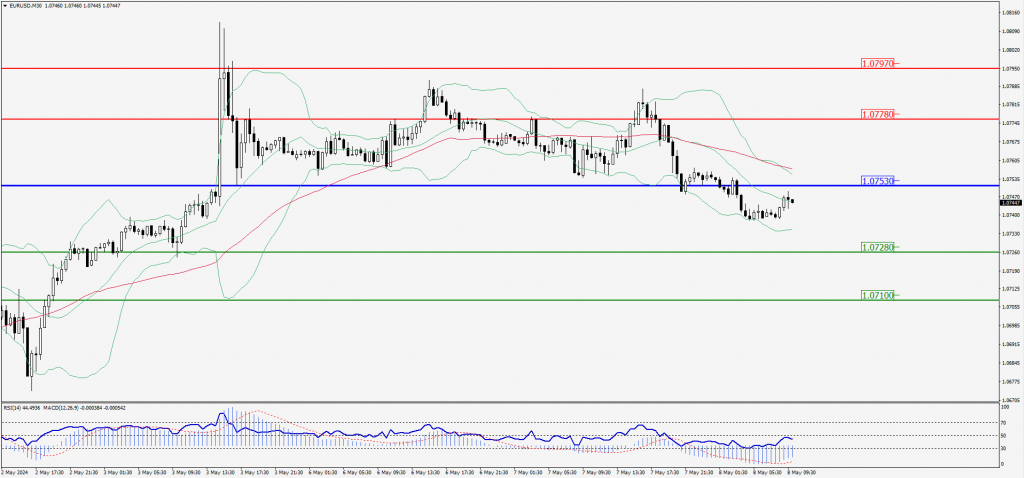
EUR/USD Intraday: Resistance level at 1.07530
Our pivot point is at 1.07530
Preferable Price Action: Take sell positions below pivot level with targets at 1.07280 & 1.07100 in extension.
Alternative Price Action: Above pivot looks for a further upside to 1.07780 & 1.07970.
Comment: RSI is below 50 levels and pairs below its 55MA.
Green Lines Indicate Resistance Levels – Red Lines Indicate Support Levels
Light Blue is a Pivot Point – Black represents the price when the report was produced
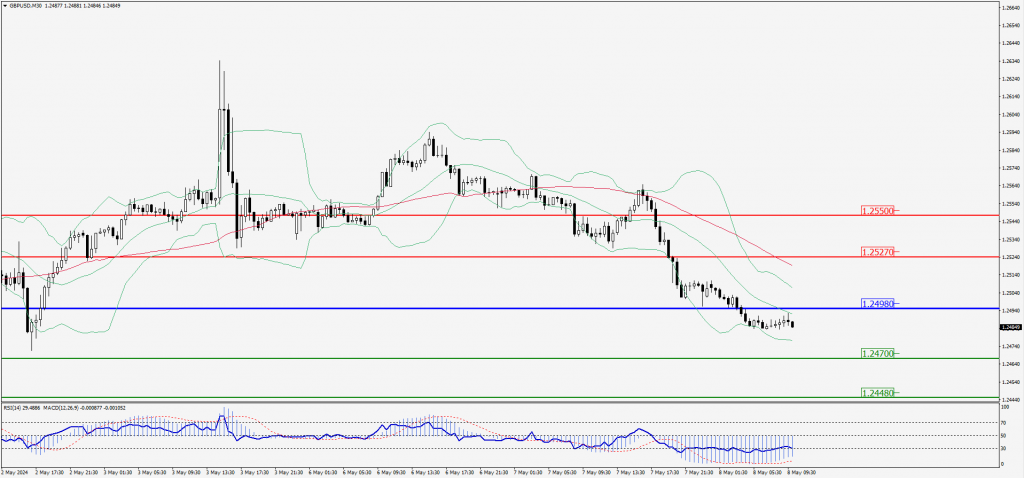
GBP/USD Intraday: Major trend on the downside
Our pivot point is at 1.24980
Preferable Price Action: Sell positions below pivot with targets at 1.24700 & 1.24480 in extension.
Alternative Price Action: The price above pivot would call for further upside to 1.25270 & 1.25500.
Comment: RSI is below 50 levels and pairs below its 20MA & 55MA.
Green Lines Indicate Resistance Levels – Red Lines Indicate Support Levels
Light Blue is a Pivot Point – Black represents the price when the report was produced
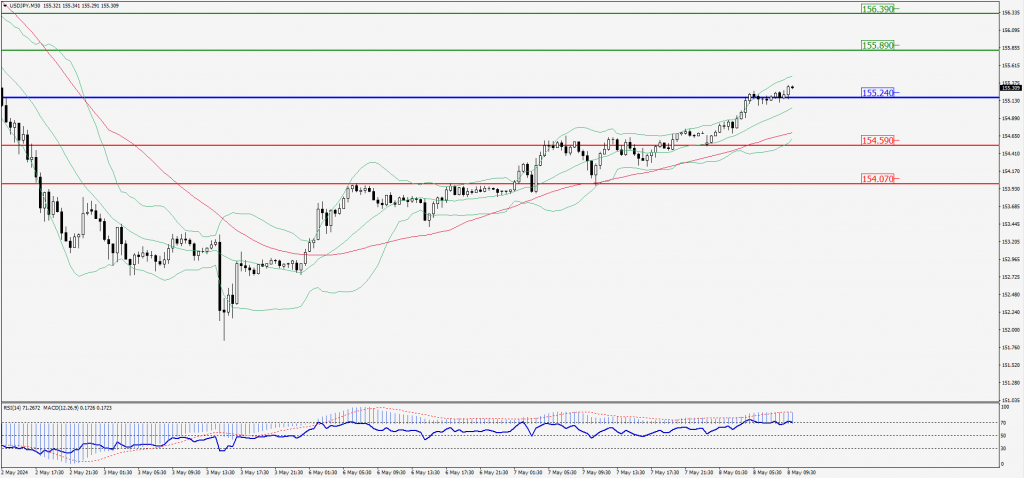
USD/JPY Intraday: Major trend on the upside
Our pivot point is at 155.240
Preferable Price Action: Buy position above pivot with the target at 155.890 and 156.390 in extension.
Alternative Price Action: The downside breakout of the pivot would call for 154.590 and 154.070.
Comment: MACD is above 50 levels and Pairs above its 20MA & 55MA.
Green Lines Indicate Resistance Levels – Red Lines Indicate Support Levels
Light Blue is a Pivot Point – Black represents the price when the report was produced
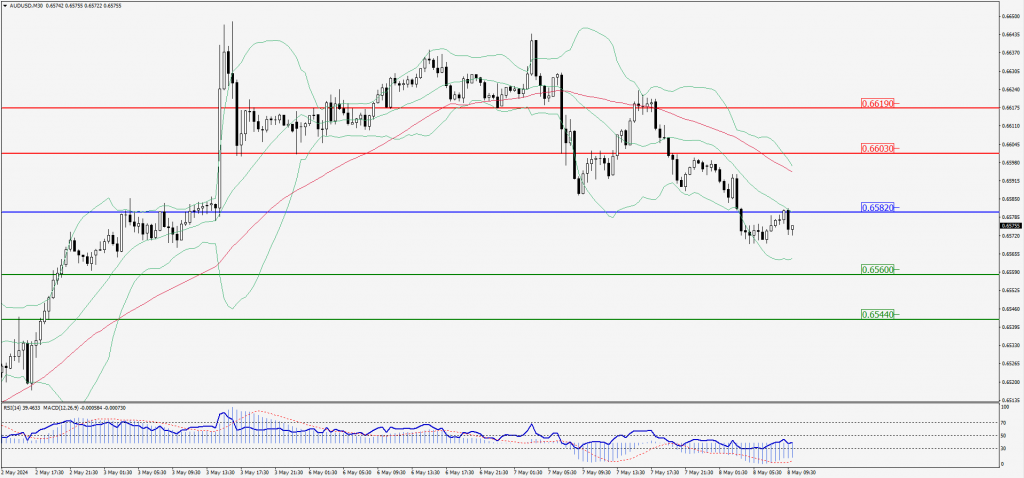
AUD/USD Intraday: Trend on the downside
Our pivot point is at 0.65820
Preferable Price Action: Sell positions below pivot with targets at 0.65600 & 0.65440 in extension.
Alternative Price Action: Above pivot looks for a further upside with 0.66030 & 0.66190 as targets.
Comment: RSI is below 50 levels and pairs below its 20MA & 55MA.
Green Lines Indicate Resistance Levels – Red Lines Indicate Support Levels
Light Blue is a Pivot Point – Black represents the price when the report was produced
CRUDEOIL Intraday: Major trend on the downside
Our pivot point is at 77.49
Preferable Price Action: Below pivot sell oil with 77.05 & 76.66 as targets.
Alternative Price Action: Buy crude above pivot with targets at 77.94 and 78.35 in extension.
Comment: MACD is negative territory and Pairs below its 20MA & 55MA.
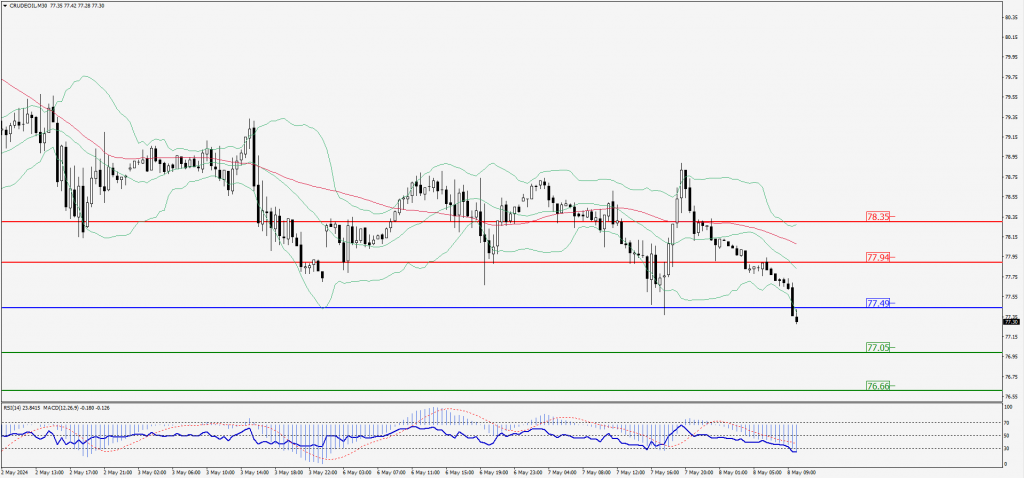
Green Lines Indicate Resistance Levels – Red Lines Indicate Support Levels
Light Blue is a Pivot Point – Black represents the price when the report was produced
XAU/USD Intraday: Trend on the downside
Our pivot point is 2315.70
Preferable Price Action: Further downside to 2307.80 and 2301.50.
Alternative Price Action: If the price gives an upside breakout of a pivot, then the price extends to 2323.50 and 2330.10.
Comment: MACD is below 50 levels and pairs below 55MA.
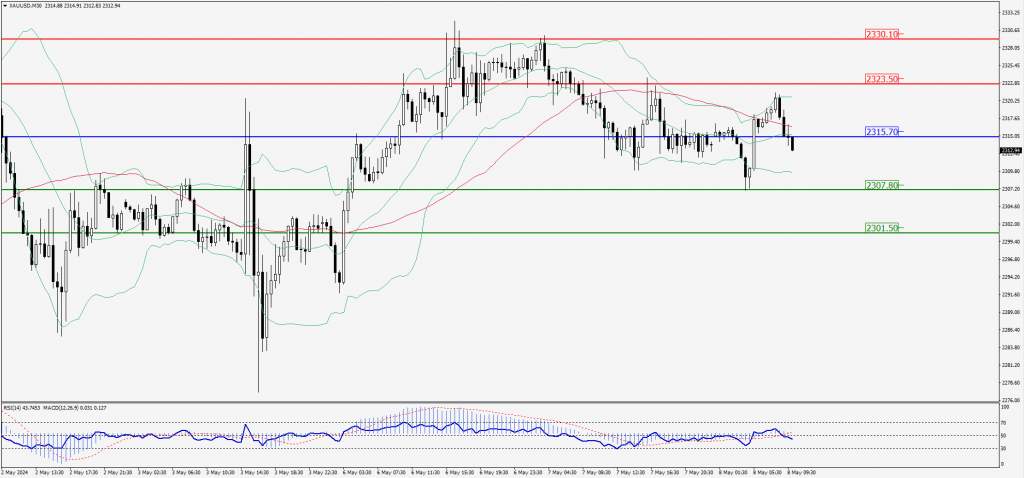
Green Lines Indicate Resistance Levels – Red Lines Indicate Support Levels
Light Blue is a Pivot Point – Black represents the price when the report was produced
Dow Jones Intraday: Trend on the upside
Our pivot point is 38,859.60
Preferable Price Action: Take buy positions above the pivot with targets at 39,041.30 & 39,186.30.
Alternative Price Action: Above 38,859.60 looks for further downside to 38,673.70 & 38,514.50.
Comment: RSI is above 50 levels.
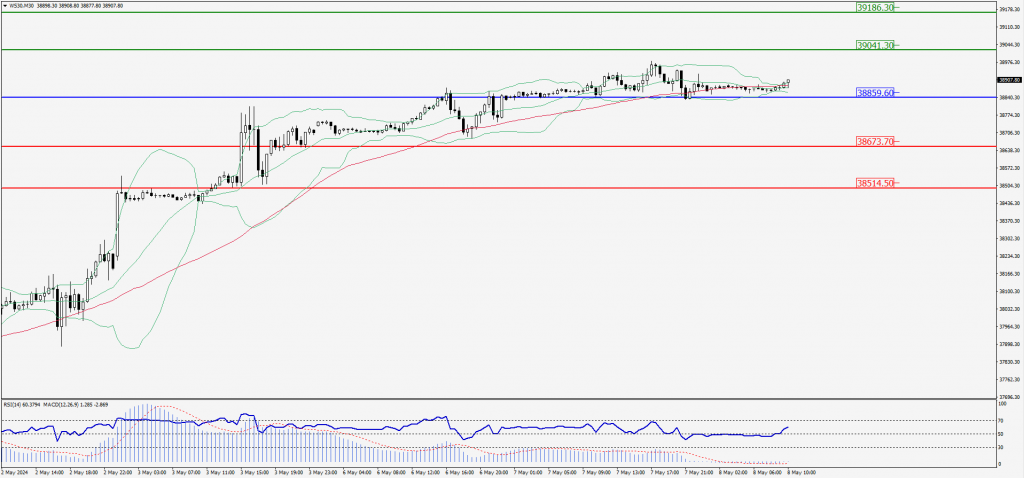
Green Lines Indicate Resistance Levels – Red Lines Indicate Support Levels
Light Blue is a Pivot Point – Black represents the price when the report was produced