Market Wrap: Stocks, Bonds, Commodities
Stocks surged in their best three-day rally since November, driven by speculation of potential interest rate cuts by the Federal Reserve this year.
The Dow Jones Industrial Average rose 176.59 points to 38,852.27, the S&P 500 gain 1.03% to 5,180.74 and the Nasdaq Composite surged 192.92 points to 16,349.25.
MSCI’s index of Asia-Pacific stocks outside Japan is surged 0.08% to 677.14 levels. The Australian index was high by 1.44% to 7,793.30. Japanese Nikkei Index surged 1.47% today.
European stocks were positive on Tuesday, with the Stoxx Europe 50 Index increase 0.66% to 4,989.65, Germany’s DAX surged 0.75% to 18,307.75, and France’s CAC higher 0.41% to 8,029.17 and U.K.’s FTSE 100 gain 1.08% to 8,302.42.
Benchmark 10-year U.S. Treasury rose as demand for safe assets slipped again, today 10-year bond yields negative 0.49% to 4.4650.
Oil climbed 0.5% in early Asian trading, while US stock futures held steady despite Israel rejecting Hamas’s ceasefire proposal in Gaza. The US equity benchmark surpassed 5,180 on Monday.
Spot Brent crude oil decline 0.19% to $83.17 per barrel. US West Texas Intermediate crude is down 0.14% to $78.37 a barrel.
The yellow metal gold is decrease 0.38% to 2,322.40 dollars per ounce.
Market Wrap: Forex
The U.S. dollar was broadly steady on Tuesday while the yen trimmed earlier losses as Japanese officials issued fresh warnings following two rounds of suspected dollar-selling intervention last week.
Today, the U.S. dollar index measures the Greenback against a trade-weighted basket of six major currencies, which surged 0.21% to 105.135.
The Euro US Dollar (EUR/USD) is a widely traded pair that is down 0.05% today. This left the pair trading around $1.07630.
The Japanese yen was negative against the U.S. dollar on Tuesday. Today USD/JPY is higher 0.46% to the 154.59 level.
Another commodity-related currency negative against the U.S dollar, AUD/USD fell 0.36% to 0.66000, and NZD/USD decend 0.04% to 0.60060 level.
EUR/USD Intraday: Resistance level at 1.07700
Our pivot point is at 1.07700
Preferable Price Action: Take sell positions below pivot level with targets at 1.07450 & 1.07270 in extension.
Alternative Price Action: Above pivot looks for a further upside to 1.07950 & 1.08120.
Comment: RSI is below 50 levels and pairs below its 20MA & 55MA.
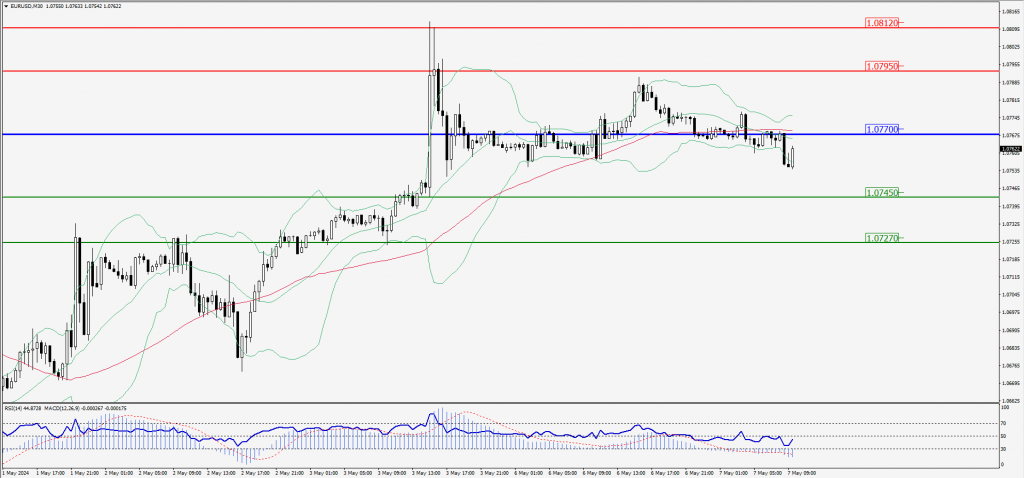
Green Lines Indicate Resistance Levels – Red Lines Indicate Support Levels
Light Blue is a Pivot Point – Black represents the price when the report was produced
GBP/USD Intraday: Trend on the downside
Our pivot point is at 1.25500
Preferable Price Action: Sell positions below pivot with targets at 1.25220 & 1.25020 in extension.
Alternative Price Action: The price above pivot would call for further upside to 1.25780 & 1.25980.
Comment: RSI is below 50 levels and pairs below its 20MA & 55MA.
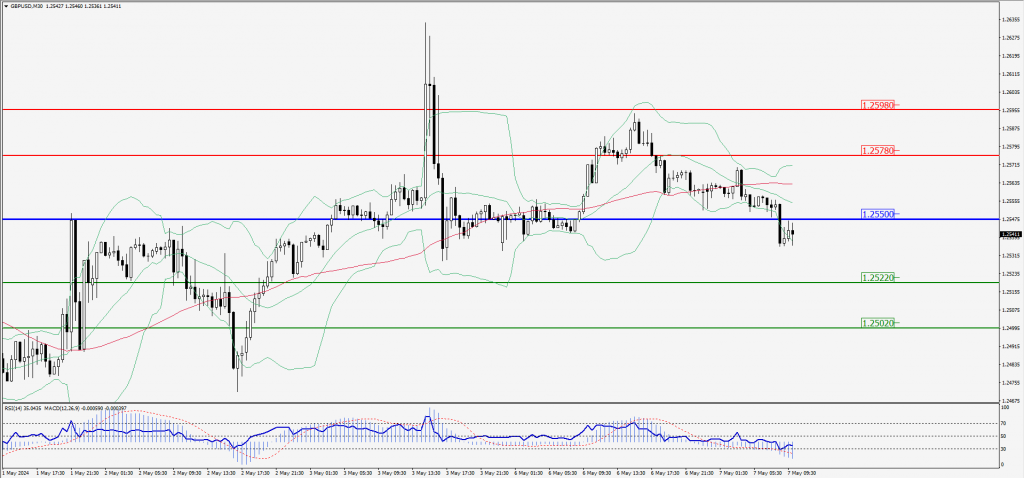
Green Lines Indicate Resistance Levels – Red Lines Indicate Support Levels
Light Blue is a Pivot Point – Black represents the price when the report was produced
USD/JPY Intraday: Trend on the upside
Our pivot point is at 154.200
Preferable Price Action: Buy position above pivot with the target at 155.270 and 156.070 in extension.
Alternative Price Action: The downside breakout of the pivot would call for 153.180 and 152.430.
Comment: MACD is above 50 levels and Pairs above its 55MA.
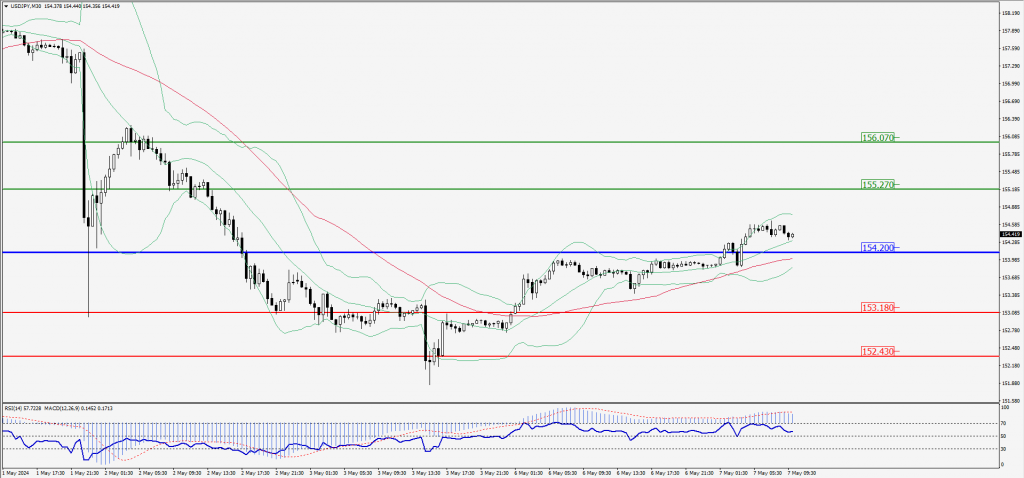
Green Lines Indicate Resistance Levels – Red Lines Indicate Support Levels
Light Blue is a Pivot Point – Black represents the price when the report was produced
AUD/USD Intraday: Trend on the downside
Our pivot point is at 0.66070
Preferable Price Action: Sell positions below pivot with targets at 0.65750 & 0.65510 in extension.
Alternative Price Action: Above pivot looks for a further upside with 0.66400 & 0.66630 as targets.
Comment: RSI is below 50 levels and pairs below its 20MA & 55MA.
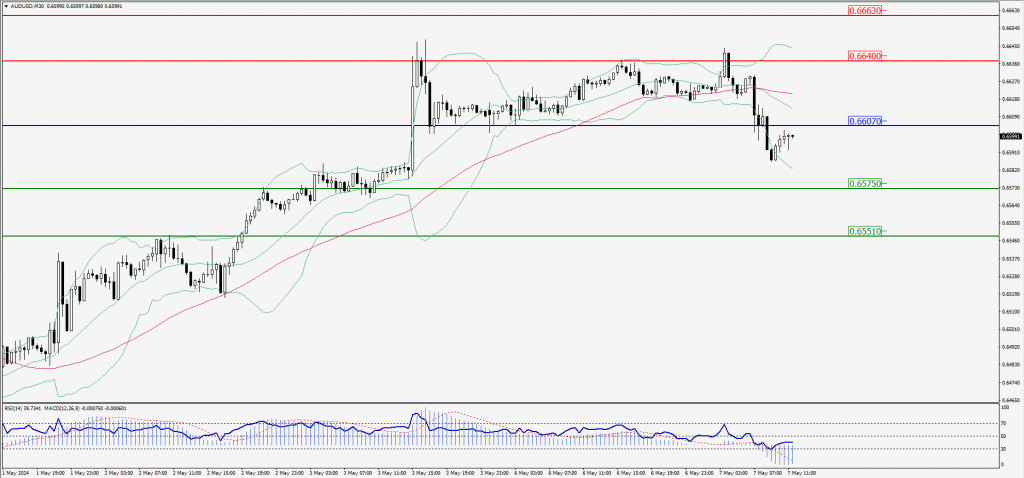
Green Lines Indicate Resistance Levels – Red Lines Indicate Support Levels
Light Blue is a Pivot Point – Black represents the price when the report was produced
CRUDEOIL Intraday: Support level at 78.34
Our pivot point is at 78.34
Preferable Price Action: Above pivot buy oil with 79.02 & 79.61 as targets.
Alternative Price Action: Sell crude below pivot with targets at 77.71 and 77.13 in extension.
Comment: MACD is positive territory.
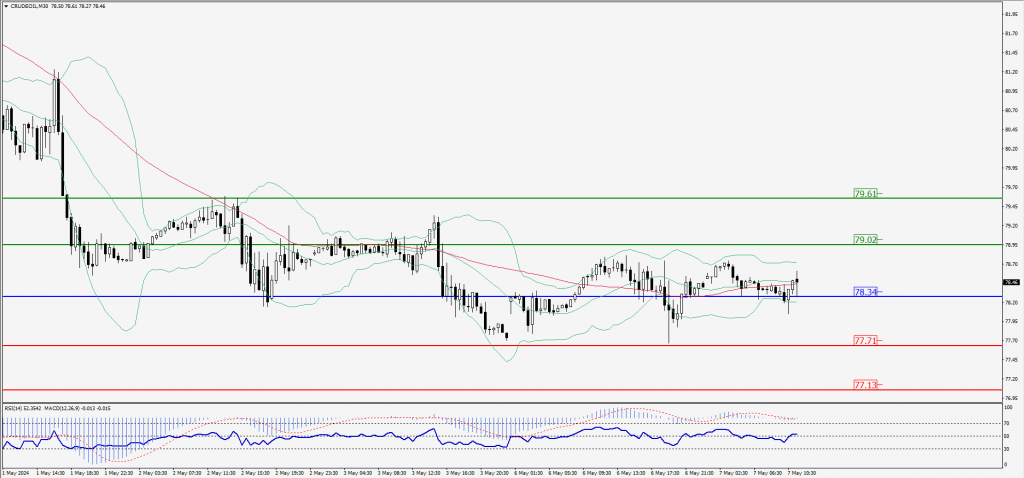
Green Lines Indicate Resistance Levels – Red Lines Indicate Support Levels
Light Blue is a Pivot Point – Black represents the price when the report was produced
XAU/USD Intraday: Trend on the downside
Our pivot point is 2319.50
Preferable Price Action: Further downside to 2310.50 and 2303.20.
Alternative Price Action: If the price gives an upside breakout of a pivot, then the price extends to 2327.60 and 2334.00.
Comment: MACD is below 50 levels and pairs below its 20MA & 55MA.
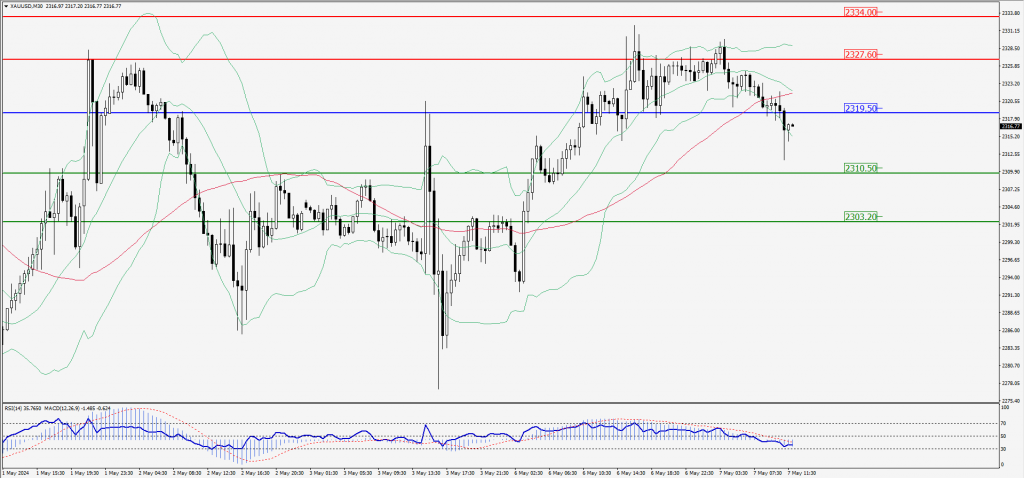
Green Lines Indicate Resistance Levels – Red Lines Indicate Support Levels
Light Blue is a Pivot Point – Black represents the price when the report was produced
Dow Jones Intraday: Major trend on the upside
Our pivot point is 38,898.00
Preferable Price Action: Take buy positions above the pivot with targets at 39,086.60 & 39,213.20.
Alternative Price Action: Above 38,898.00 looks for further downside to 38,714.30 & 38,587.70.
Comment: RSI is above 50 levels and Pairs above its 55MA.
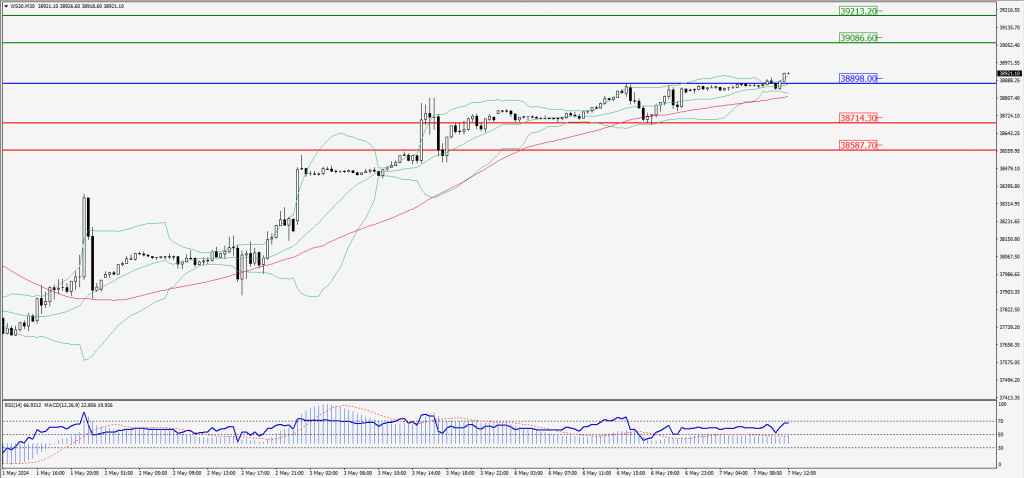
Green Lines Indicate Resistance Levels – Red Lines Indicate Support Levels
Light Blue is a Pivot Point – Black represents the price when the report was produced