Market Wrap: Stocks, Bonds, Commodities
Stocks futures were flat in overnight trading after the S&P 500 notched its highest closing level of 2023. The tail-end of earnings season pressed on with results from Dave & Buster’s and Stitch Fix. Dave & Buster’s gained about 4 percent after the bell, while Stitch Fix added nearly 5 percent.
The Dow Jones Industrial Average rose 10.42 points to 33,573.28, the S&P 500 gain 0.24% to 4,283.85 and the Nasdaq Composite add 46.99 points to 13,276.42.
MSCI’s index of Asia-Pacific stocks outside Japan is advance 0.59% to 636.63 levels. The Australian index was lower by 0.16% to 7,118.00. Japanese Nikkei Index decline 1.82% today.
European stocks were negative on Wednesday, with the Stoxx Europe 50 Index fell 0.34% to 4,279.15, Germany’s DAX decline 0.42% to 15,925.75, and France’s CAC drop 0.39% to 7,181.33 and U.K.’s FTSE 100 subtract 0.02% to 7,626.70.
Benchmark 10-year U.S. Treasury fell as demand for safe assets ascend again, today 10-year bond yields negative 0.63% to 3.6800.
Oil prices were little changed on Tuesday after erasing earlier losses as worries over sluggish global economic growth that could reduce energy demand offset Saudi Arabia’s pledge to deepen output cuts.
Spot Brent crude oil ascend 0.10% to $76.37 per barrel. US West Texas Intermediate crude is up 0.20% to $71.86 a barrel.
The yellow metal gold is decline 0.26% to 1,976.25 dollars per ounce.
Market Wrap: Forex
The dollar edged lower on Wednesday as traders assessed the odds of a rate hike by the Federal Reserve next week, while the Aussie scaled a fresh three-week high in the wake of a rate increase and a decidedly hawkish stance by its central bank .
Today, the U.S. dollar index measures the Greenback against a trade-weighted basket of six major currencies, which surged 0.01% to 104.080.
The Euro US Dollar (EUR/USD) is a widely traded pair that is down 0.05% today. This left the pair trading around $1.06880.
The Japanese yen was negative against the U.S. dollar on Wednesday. Today USD/JPY is slipped 0.18% to the 139.380 level.
Another commodity-related currency mixed against the U.S dollar, AUD/USD rose 0.27% to 0.66880, and NZD/USD slipped 0.01% to 0.60770 level.
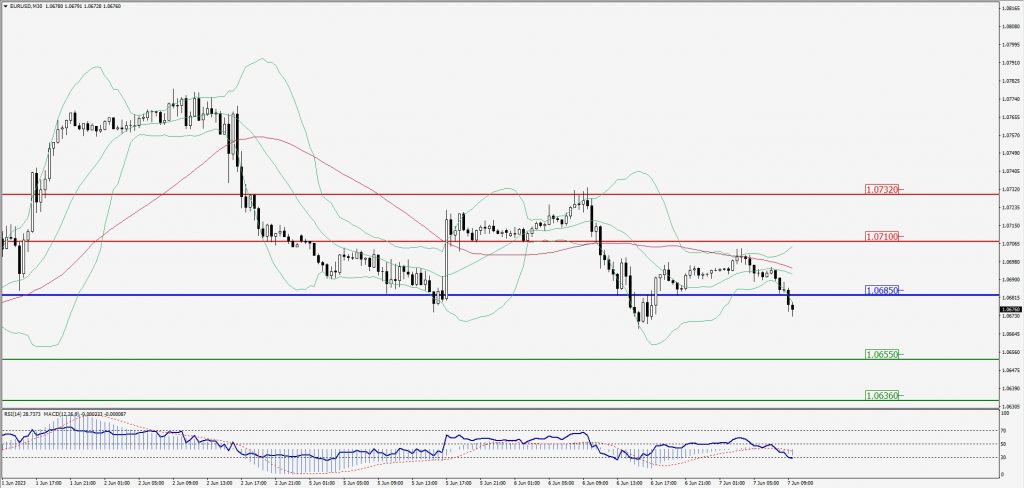
EUR/USD Intraday: Trend on the downside
Our pivot point is at 1.06850
Preferable Price Action: Take sell positions below pivot level with targets at 1.06550 & 1.06360 in extension.
Alternative Price Action: Above pivot looks for a further upside to 1.07100 & 1.07320.
Comment: RSI is below 50 levels and Pairs below its 20MA & 55MA.
Green Lines Indicate Resistance Levels – Red Lines Indicate Support Levels
Light Blue is a Pivot Point – Black represents the price when the report was produced
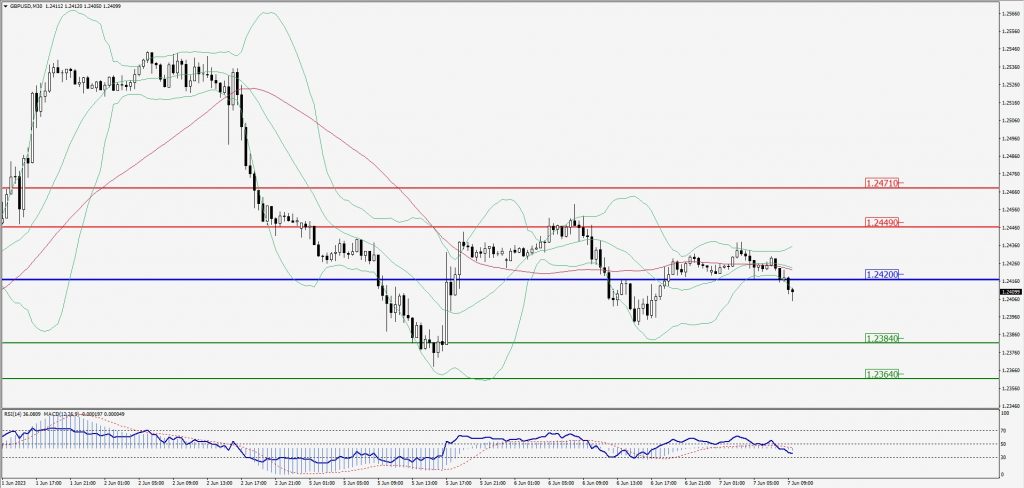
GBP/USD Intraday: Trend on the downside
Our pivot point is at 1.24200
Preferable Price Action: Sell positions below pivot with targets at 1.23840 & 1.23640 in extension.
Alternative Price Action: The price above pivot would call for further upside to 1.24490 & 1.24710.
Comment: RSI is below 50 levels and Pairs below its 20MA & 55MA.
Green Lines Indicate Resistance Levels – Red Lines Indicate Support Levels
Light Blue is a Pivot Point – Black represents the price when the report was produced
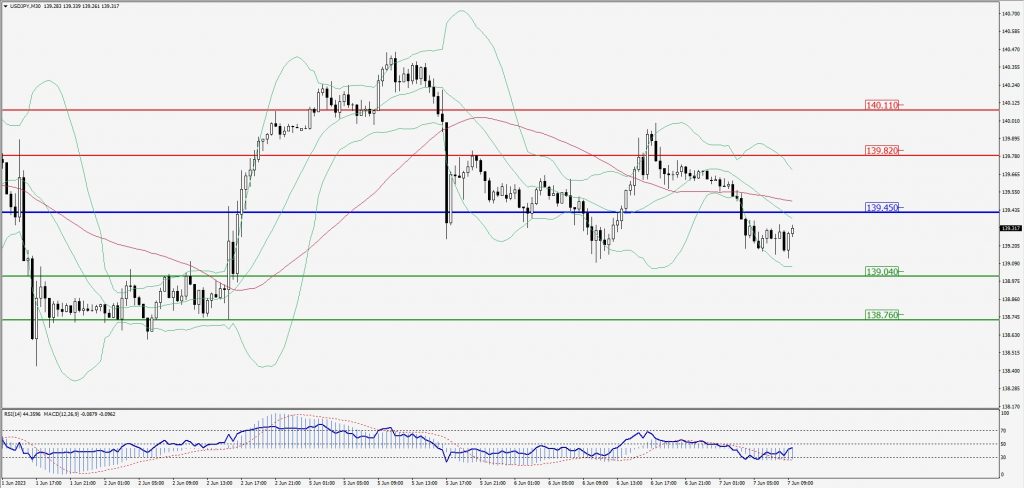
USD/JPY Intraday: Trend on the downside
Our pivot point is at 139.450
Preferable Price Action: Sell position below pivot with the target at 139.040 and 138.760 in extension.
Alternative Price Action: The upside breakout of the pivot would call for 139.820 and 140.110.
Comment: MACD is below 50 level and Pairs below its 20MA & 55MA.
Green Lines Indicate Resistance Levels – Red Lines Indicate Support Levels
Light Blue is a Pivot Point – Black represents the price when the report was produced
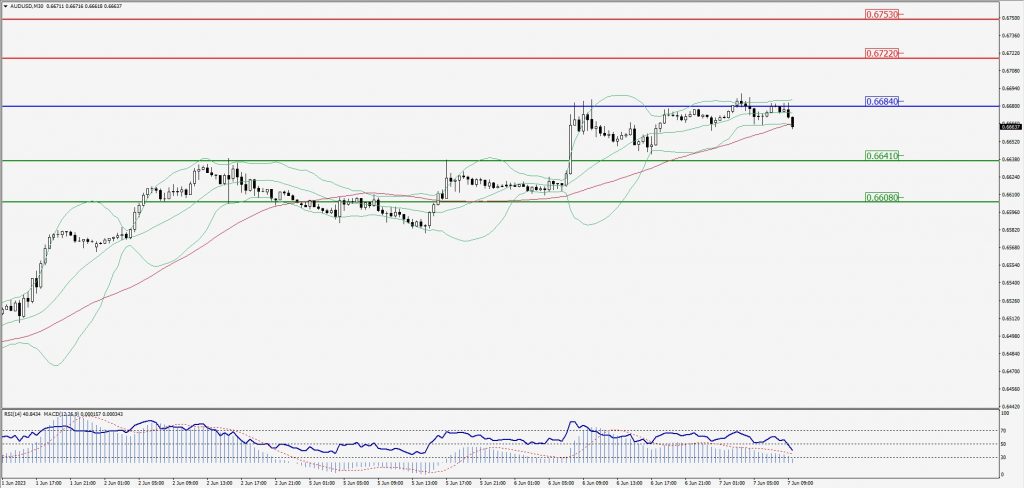
AUD/USD Intraday: Resistance level at 0.66840
Our pivot point is at 0.66840
Preferable Price Action: Sell positions below pivot with targets at 0.66410 & 0.66080 in extension.
Alternative Price Action: Above pivot looks for a further upside with 0.67220 & 0.67530 as targets.
Comment: RSI is below 50 levels and Pairs below 20MA.
Green Lines Indicate Resistance Levels – Red Lines Indicate Support Levels
Light Blue is a Pivot Point – Black represents the price when the report was produced
CRUDEOIL Intraday: Trend on the downside
Our pivot point is at 71.85
Preferable Price Action: Below pivot sell oil with 70.57 & 69.76 as targets.
Alternative Price Action: Buy crude above pivot with targets at 73.06 and 73.85 in extension.
Comment: MACD is negative territory and Pairs below 20MA.
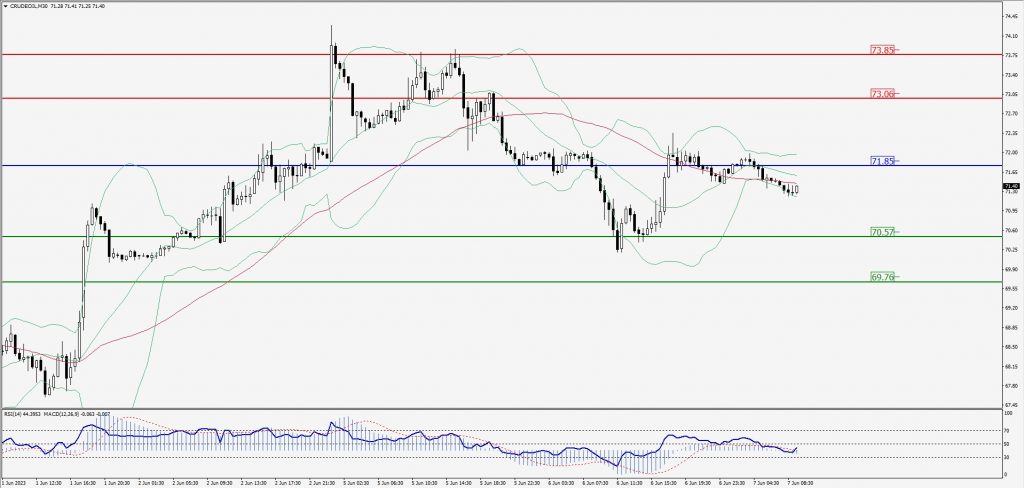
Green Lines Indicate Resistance Levels – Red Lines Indicate Support Levels
Light Blue is a Pivot Point – Black represents the price when the report was produced
XAU/USD Intraday: Major trend on the downside
Our pivot point is 1961.90
Preferable Price Action: Further downside to 1952.50 and 1944.40
Alternative Price Action: If the price gives a upside breakout of a pivot, then the price extends to 1970.30 and 1977.60.
Comment: MACD is below 50 level and Pairs below its 20MA & 55MA.
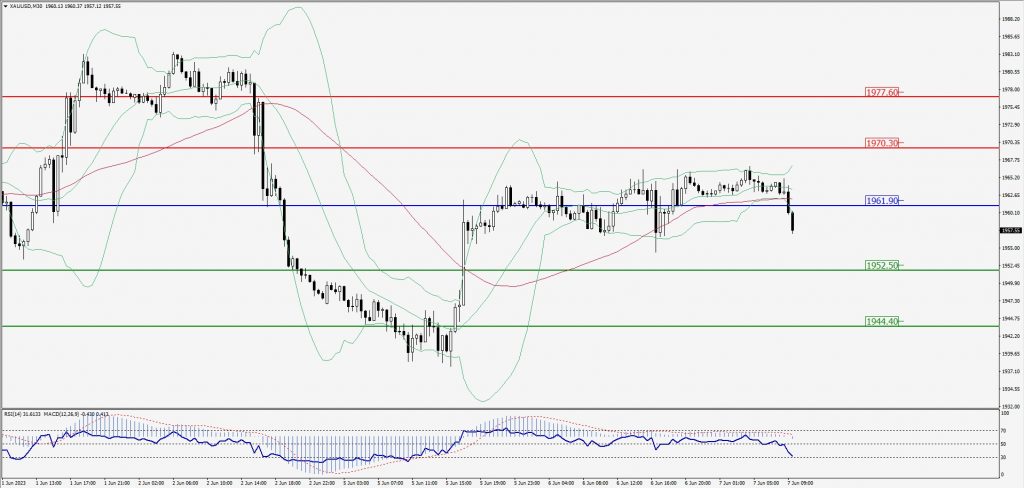
Green Lines Indicate Resistance Levels – Red Lines Indicate Support Levels
Light Blue is a Pivot Point – Black represents the price when the report was produced
Dow Jones Intraday: Resistance level at 33,616.00
Our pivot point is 33,616.00
Preferable Price Action: Take sell positions above the pivot with targets at 33,460.00 & 33,338.00.
Alternative Price Action: Above 33,616.00 looks for further upside to 33,781.00 & 33,904.00.
Comment: RSI is below 50 levels and Pairs below 20MA.
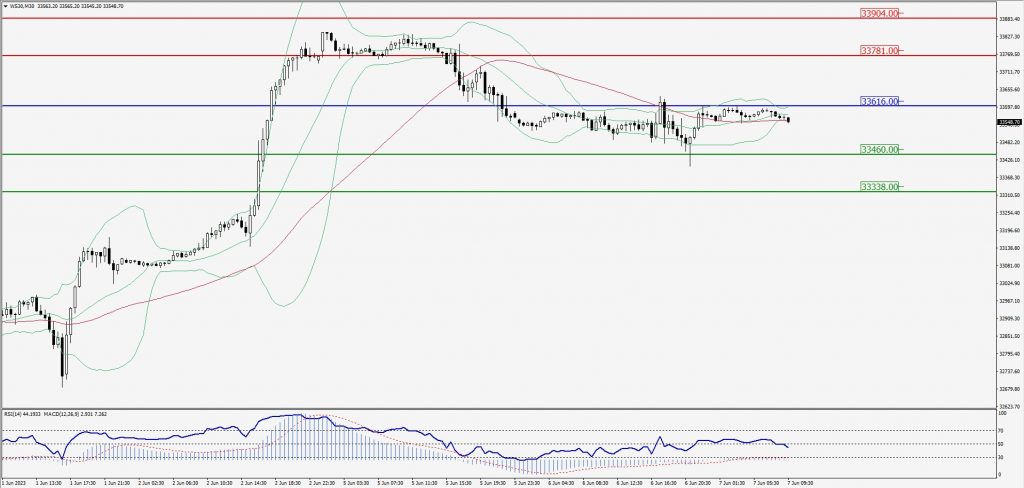
Green Lines Indicate Resistance Levels – Red Lines Indicate Support Levels
Light Blue is a Pivot Point – Black represents the price when the report was produced