Market Wrap: Stocks, Bonds, Commodities
Stock futures are modestly lower as investors are coming off a losing session that took a small bite out of last week’s advance.
The Dow Jones Industrial Average fell 199.90 points to 33,562.86, the S&P 500 lose 0.20% to 4,273.79 and the Nasdaq Composite subtract 11.34 points to 13,229.43.
MSCI’s index of Asia-Pacific stocks outside Japan is decline 0.14% to 631.94 levels. The Australian index was lower by 1.20% to 7,129.60. Japanese Nikkei Index advance 0.90% today.
European stocks were negative on Tuesday, with the Stoxx Europe 50 Index fell 0.24% to 4,282.95, Germany’s DAX decline 0.12% to 15,944.68, and France’s CAC drop 0.22% to 7,185.22 and U.K.’s FTSE 100 subtract 0.43% to 7,567.44.
Benchmark 10-year U.S. Treasury fell as demand for safe assets ascend again, today 10-year bond yields positive 0.77% to 3.6640.
Oil prices rose following OPEC kingpin Saudi Arabia’s decision to cut production by another million barrels per day.
Spot Brent crude oil drop 2.27% to $74.97 per barrel. US West Texas Intermediate crude is down 2.58% to $70.47 a barrel.
The yellow metal gold is advance 0.13% to 1,976.75 dollars per ounce.
Market Wrap: Forex
The U.S. dollar retreated in early European trade Tuesday, while the Australian dollar soared after the RBA hiked interest rates once more in its fight against elevated inflation.
Today, the U.S. dollar index measures the Greenback against a trade-weighted basket of six major currencies, which surged 0.04% to 103.980.
The Euro US Dollar (EUR/USD) is a widely traded pair that is down 0.13% today. This left the pair trading around $1.06990.
The Japanese yen was negative against the U.S. dollar on Tuesday. Today USD/JPY is slipped 0.25% to the 139.240 level.
Another commodity-related currency positive against the U.S dollar, AUD/USD rose 0.62% to 0.66580, and NZD/USD surged 0.21% to 0.60830 level.
EUR/USD Intraday: Support level at 1.07190
Our pivot point is at 1.07190
Preferable Price Action: Take buy positions above pivot level with targets at 1.07480 & 1.07700 in extension.
Alternative Price Action: Below pivot looks for a further downside to 1.06910 & 1.06700.
Comment: RSI is above 50 levels and Pairs above its 20MA & 55MA.
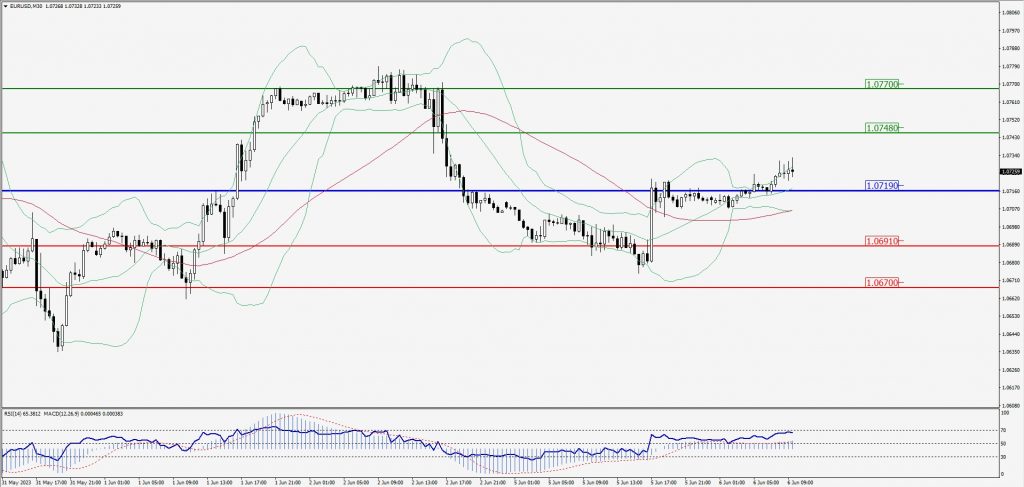
Green Lines Indicate Resistance Levels – Red Lines Indicate Support Levels
Light Blue is a Pivot Point – Black represents the price when the report was produced
GBP/USD Intraday: Trend on the upside
Our pivot point is at 1.24320
Preferable Price Action: Buy positions above pivot with targets at 1.24670 & 1.24920 in extension.
Alternative Price Action: The price below pivot would call for further downside to 1.24030 & 1.23810.
Comment: RSI is above 50 levels and Pairs above 55MA.
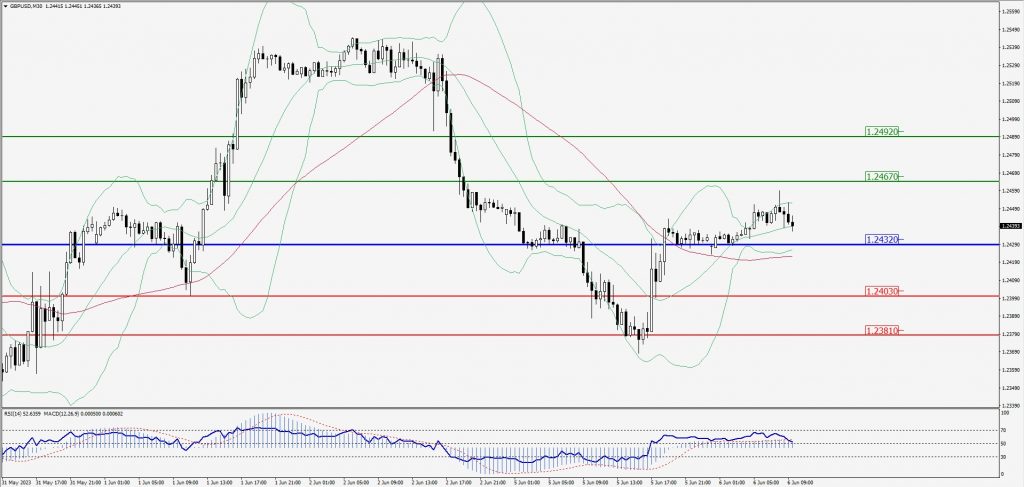
Green Lines Indicate Resistance Levels – Red Lines Indicate Support Levels
Light Blue is a Pivot Point – Black represents the price when the report was produced
USD/JPY Intraday: Trend on the downside
Our pivot point is at 139.530
Preferable Price Action: Sell position below pivot with the target at 139.050 and 138.750 in extension.
Alternative Price Action: The upside breakout of the pivot would call for 139.980 and 140.320.
Comment: MACD is below 50 level and Pairs below its 20MA & 55MA.
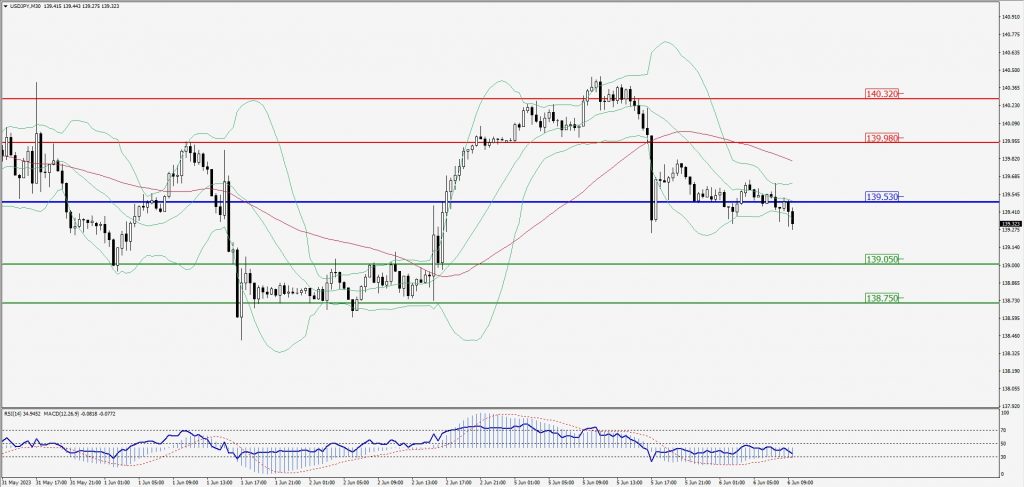
Green Lines Indicate Resistance Levels – Red Lines Indicate Support Levels
Light Blue is a Pivot Point – Black represents the price when the report was produced
AUD/USD Intraday: Major trend on the upside
Our pivot point is at 0.66630
Preferable Price Action: Buy positions above pivot with targets at 0.66990 & 0.67270 in extension.
Alternative Price Action: Below pivot looks for a further downside with 0.66340 & 0.66080 as targets.
Comment: RSI is above 50 levels and Pairs above its 20MA & 55MA.
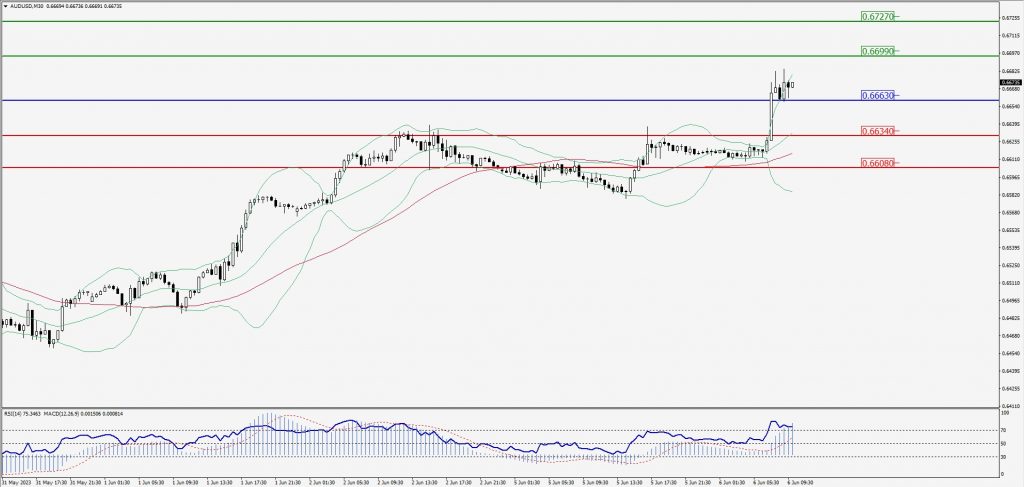
Green Lines Indicate Resistance Levels – Red Lines Indicate Support Levels
Light Blue is a Pivot Point – Black represents the price when the report was produced
CRUDEOIL Intraday: Major trend on the downside
Our pivot point is at 71.76
Preferable Price Action: Below pivot sell oil with 70.38 & 69.56 as targets.
Alternative Price Action: Buy crude above pivot with targets at 72.88 and 73.80 in extension.
Comment: MACD is negative territory and Pairs below its 20MA & 55MA.
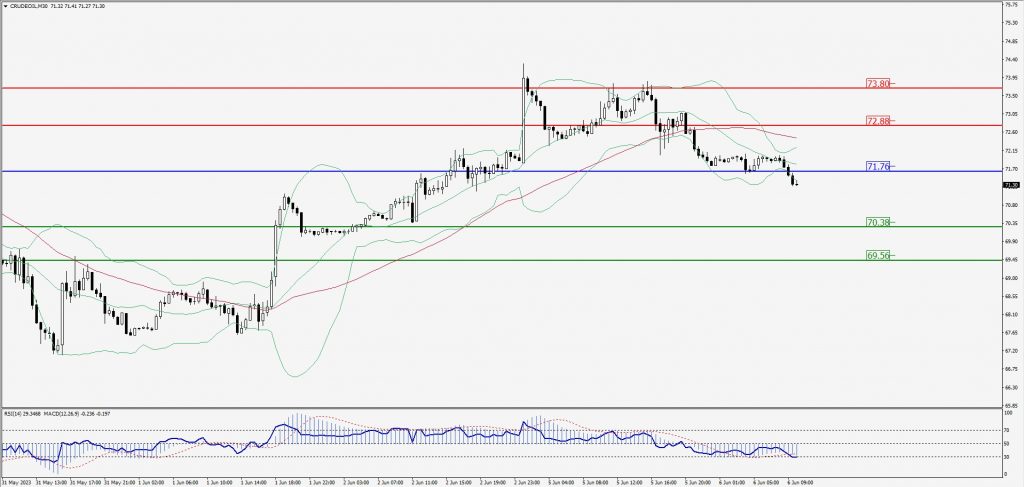
Green Lines Indicate Resistance Levels – Red Lines Indicate Support Levels
Light Blue is a Pivot Point – Black represents the price when the report was produced
XAU/USD Intraday: Support level at 1958.50
Our pivot point is 1958.50
Preferable Price Action: Further upside to 1966.80 and 1972.90
Alternative Price Action: If the price gives a downside breakout of a pivot, then the price extends to 1951.00 and 1945.80.
Comment: MACD is above 50 level and Pairs above 55MA.
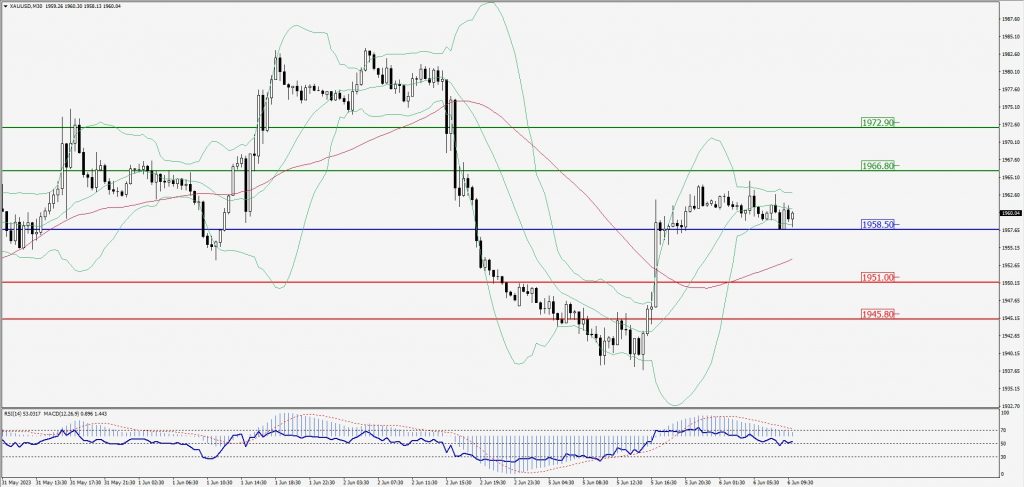
Green Lines Indicate Resistance Levels – Red Lines Indicate Support Levels
Light Blue is a Pivot Point – Black represents the price when the report was produced
Dow Jones Intraday: Trend on the downside
Our pivot point is 33,602.00
Preferable Price Action: Take sell positions above the pivot with targets at 33,399.00 & 33,260.00.
Alternative Price Action: Above 33,602.00 looks for further upside to 33,788.00 & 33,952.00.
Comment: RSI is below 50 levels and Pairs below 55MA.
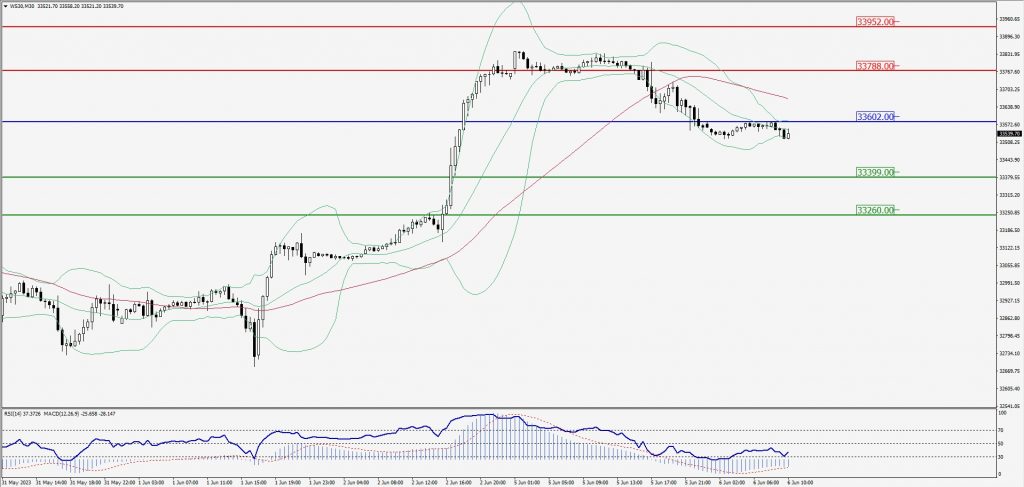
Green Lines Indicate Resistance Levels – Red Lines Indicate Support Levels
Light Blue is a Pivot Point – Black represents the price when the report was produced