Market Wrap: Stocks, Bonds, Commodities
US stock futures were little changed Wednesday night after the Nasdaq Composite fell for a fourth straight trading day.
The Dow Jones Industrial Average fell 284.85 points to 37,430.19, the S&P 500 lose 0.80% to 4,704.81 and the Nasdaq Composite subtract 173.73 points to 14,592.21.
MSCI’s index of Asia-Pacific stocks outside Japan is advance 0.06% to 628.64 levels. The Australian index was lower by 0.39% to 7,494.10. Japanese Nikkei Index drop 0.56% today.
European stocks were positive on Thursday, with the Stoxx Europe 50 Index rose 0.39% to 4,464.65, Germany’s DAX ascend 0.34% to 16,594.82, and France’s CAC advance 0.28% to 7,431.91 and U.K.’s FTSE 100 add 0.22% to 7,698.44.
Benchmark 10-year U.S. Treasury fell as deman for safe assets ascend again, today 10-year bond yields positive 0.70% to 3.9320.
Oil prices rose Wednesday after after reports of a disruption to Libya’s top oilfield added to supply concerns emanating from tensions in the Red Sea.
Spot Brent crude oil ascend 1.09% to $79.10 per barrel. US West Texas Intermediate crude is down 1.36% to $73.69 a barrel.
The yellow metal gold is advance 0.62% to 2,055.65 dollars per ounce.
Market Wrap: Forex
The dollar fell on Thursday, after rising to an almost three week high a day earlier, with minutes of the Federal Reserve’s last meeting providing few clues on when the United States might start cutting interest rates.
Today, the U.S. dollar index measures the Greenback against a trade-weighted basket of six major currencies, which slipped 0.23% to 101.965.
The Euro US Dollar (EUR/USD) is a widely traded pair that is up 0.35% today. This left the pair trading around $1.09580.
The Japanese yen was negative against the U.S. dollar on Thursday. Today USD/JPY is surged 0.37% to the 143.810 level.
Another commodity-related currency positive against the U.S dollar, AUD/USD rose 0.30% to 0.67500, and NZD/USD surged 0.30% to 0.62660 level.
EUR/USD Intraday: Trend on the upside
Preferable Price Action: Take buy positions above pivot level with targets at 1.09810 & 1.10070 in extension.
Alternative Price Action: Below pivot looks for a further downside to 1.09050 & 1.08790.
Comment: RSI is above 50 levels and Pairs above its 20MA & 55MA.
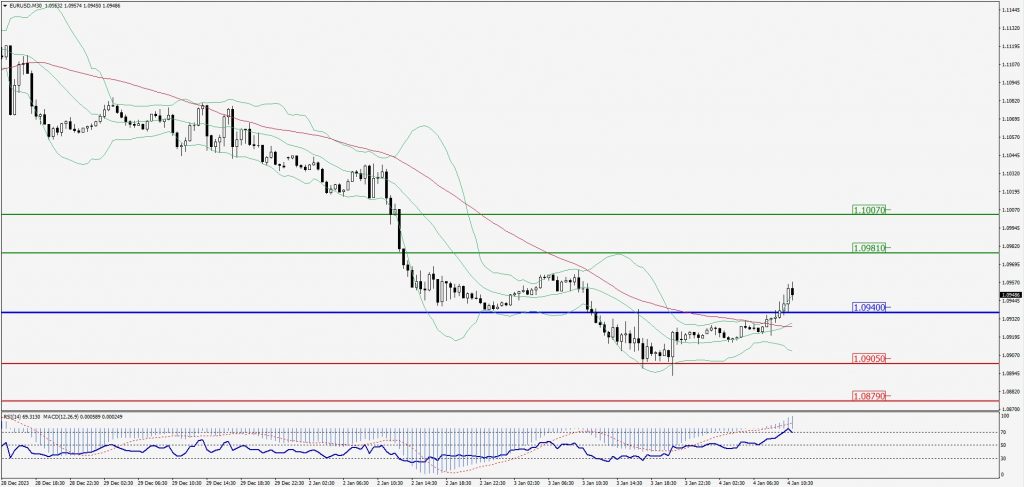
Green Lines Indicate Resistance Levels – Red Lines Indicate Support Levels
Light Blue is a Pivot Point – Black represents the price when the report was produced
GBP/USD Intraday: Major trend on the upside
Our pivot point is at 1.26840
Preferable Price Action: Buy positions above pivot with targets at 1.27130 & 1.27340 in extension.
Alternative Price Action: The price below pivot would call for further downside to 1.26610 & 1.26450.
Comment: RSI is above 50 levels and Pairs above its 20MA & 55MA.
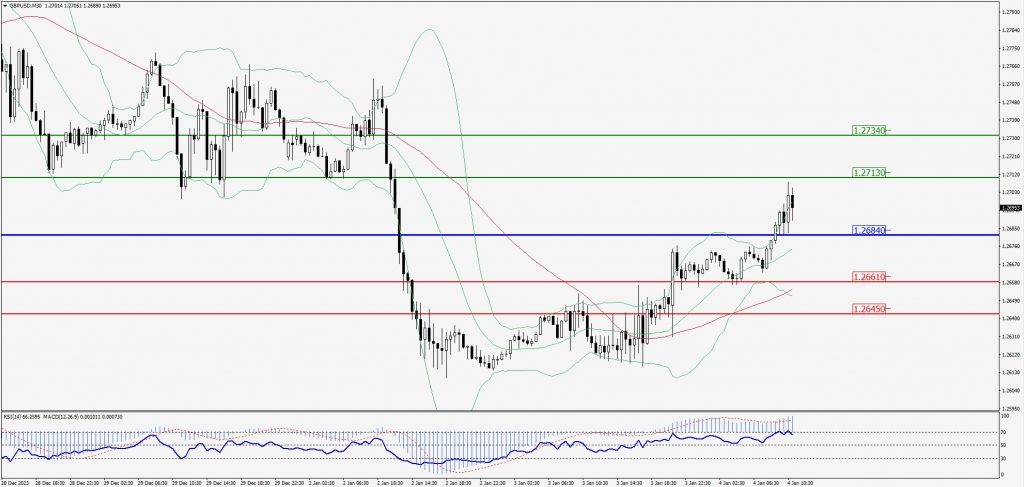
Green Lines Indicate Resistance Levels – Red Lines Indicate Support Levels
Light Blue is a Pivot Point – Black represents the price when the report was produced
USD/JPY Intraday: Trend on the upside
Our pivot point is at 143.520
Preferable Price Action: Buy position above pivot with the target at 144.120 and 144.520 in extension.
Alternative Price Action: The downside breakout of the pivot would call for 143.030 and 142.640.
Comment: MACD is above 50 level and Pairs above its 20MA & 55MA.
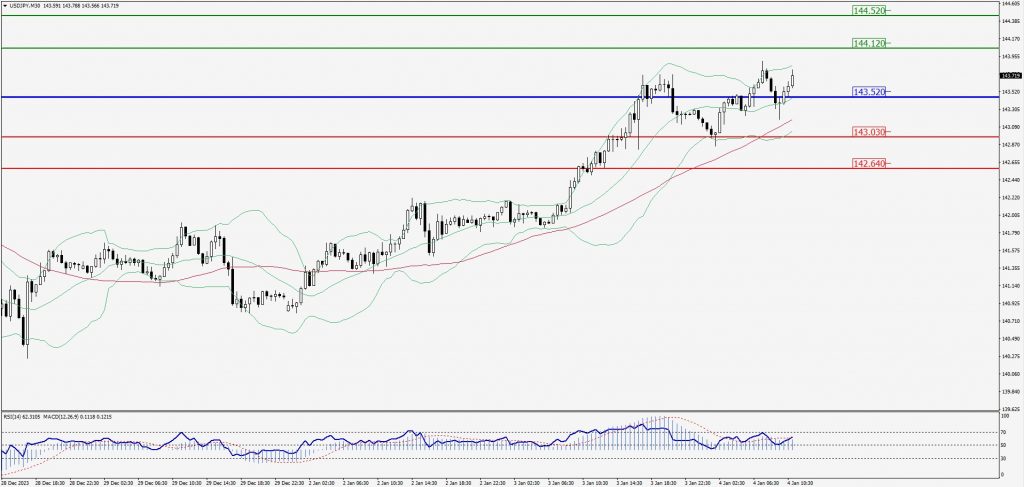
Green Lines Indicate Resistance Levels – Red Lines Indicate Support Levels
Light Blue is a Pivot Point – Black represents the price when the report was produced
AUD/USD Intraday: Trend on the downside
Our pivot point is at 0.67590
Preferable Price Action: Sell positions below pivot with targets at 0.67310 & 0.67150 in extension.
Alternative Price Action: Above pivot looks for a further upside with 0.67820 & 0.67990 as targets.
Comment: RSI is below 50 levels and Pairs below 55MA.
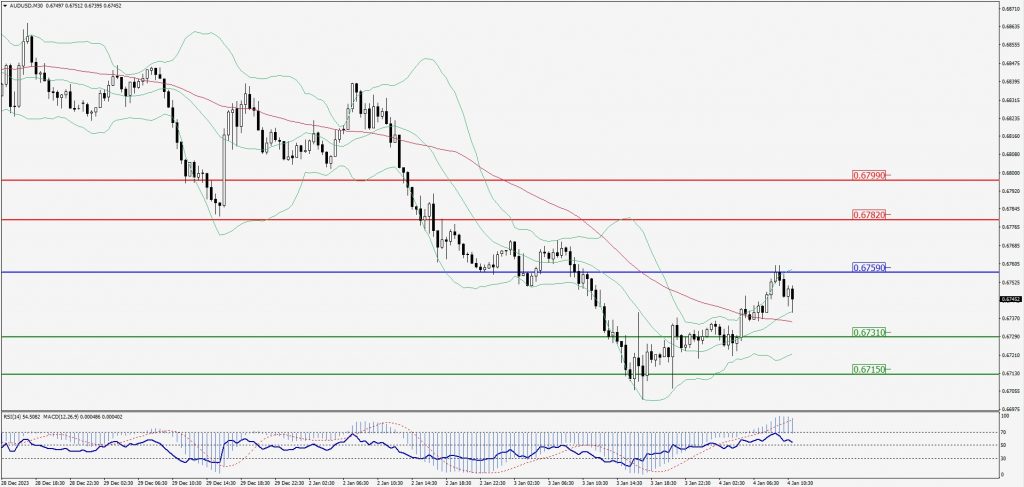
Green Lines Indicate Resistance Levels – Red Lines Indicate Support Levels
Light Blue is a Pivot Point – Black represents the price when the report was produced
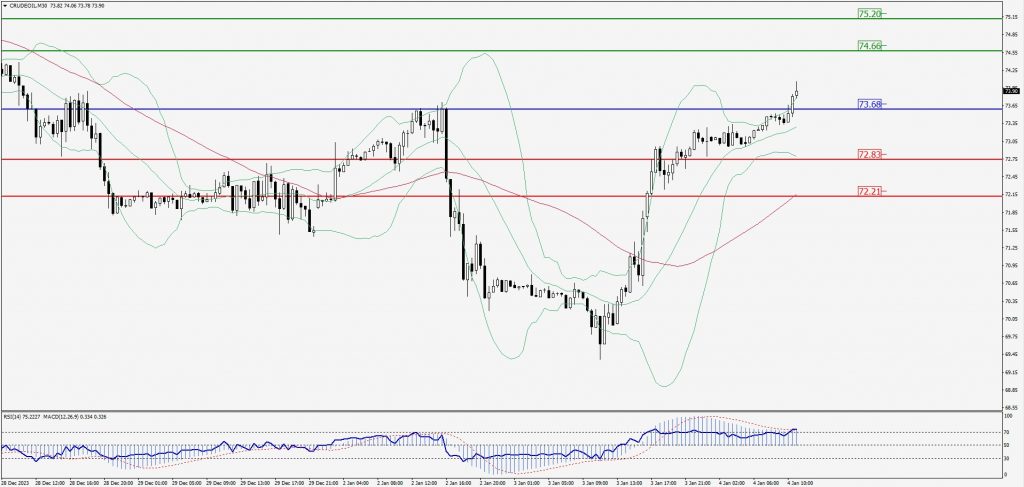
CRUDEOIL Intraday: Major trend on the upside
Our pivot point is at 73.68
Preferable Price Action: Above pivot buy oil with 74.66 & 75.20 as targets.
Alternative Price Action: Sell crude below pivot with targets at 72.83 and 72.21 in extension.
Comment: MACD is positive territory and Pairs above its 20MA & 55MA.
Green Lines Indicate Resistance Levels – Red Lines Indicate Support Levels
Light Blue is a Pivot Point – Black represents the price when the report was produced
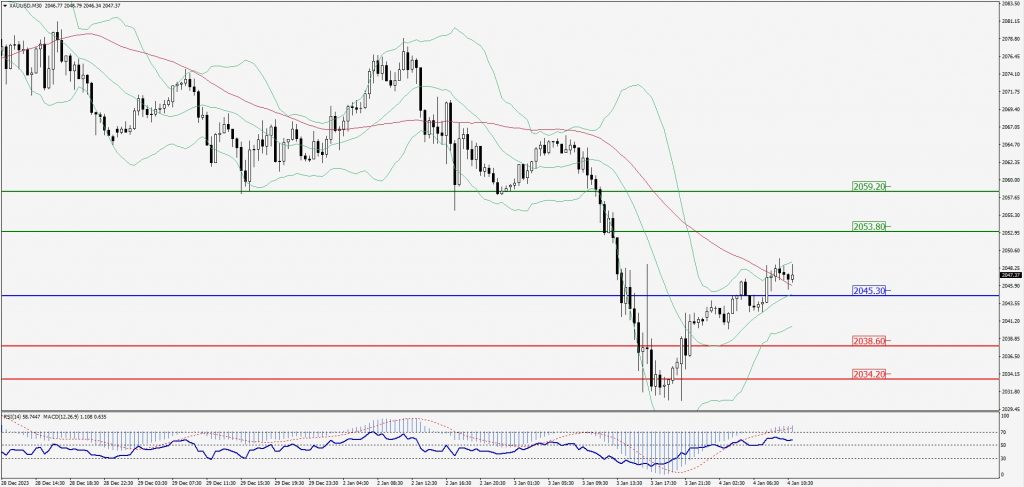
XAU/USD Intraday: Trend on the upside
Our pivot point is 2045.30
Preferable Price Action: Further upside to 2053.80 and 2059.20.
Alternative Price Action: If the price gives a downside breakout of a pivot, then the price extends to 2038.60 and 2034.20.
Comment: MACD is above 50 level and Pairs above 20MA.
Green Lines Indicate Resistance Levels – Red Lines Indicate Support Levels
Light Blue is a Pivot Point – Black represents the price when the report was produced
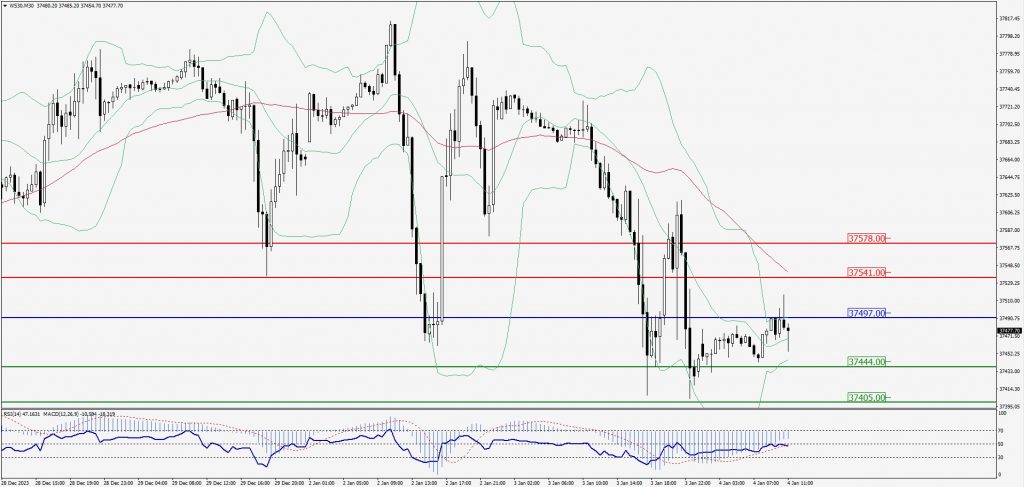
Dow Jones Intraday: Resistance level at 37,497.00
Our pivot point is 37,497.00
Preferable Price Action: Take sell positions below the pivot with targets at 37,444.00 & 37,405.00.
Alternative Price Action: Above 37,497.00 looks for further upside to 37,541.00 & 37,578.00.
Comment: RSI is below 50 levels and Pairs below 55MA.
Green Lines Indicate Resistance Levels – Red Lines Indicate Support Levels
Light Blue is a Pivot Point – Black represents the price when the report was produced