Market Wrap: Stocks, Bonds, Commodities
Stock futures were little changed in overnight trading after the Nasdaq Composite registered its worst session since October.
The Dow Jones Industrial Average rose 25.50 points to 37,715.04, the S&P 500 lose 0.57% to 4,742.83 and the Nasdaq Composite subtract 245.41 points to 14,765.94.
MSCI’s index of Asia-Pacific stocks outside Japan is decline 1.26% to 628.19 levels. The Australian index was lower by 1.37% to 7,523.20. Japanese Nikkei Index drop 0.23% today.
European stocks were negative on Wednesday, with the Stoxx Europe 50 Index fell 0.55% to 4,489.05, Germany’s DAX drop 0.75% to 16,718.23, and France’s CAC decline 0.75% to 7,474.61 and U.K.’s FTSE 100 subtract 0.12% to 7,712.61.
Benchmark 10-year U.S. Treasury fell as deman for safe assets ascend again, today 10-year bond yields positive 0.79% to 3.9800.
Oil prices were volatile on Tuesday after Iran dispatched a warship to the Red Sea, as the situation remains tense in the critical waterway for global shipments that has seen vessels attacked by Yemen’s Houthi rebels.
Spot Brent crude oil drop 1.34% to $74.88 per barrel. US West Texas Intermediate crude is down 1.42% to $69.38 a barrel.
The yellow metal gold is decline 0.32% to 2,066.90 dollars per ounce.
Market Wrap: Forex
The U.S. dollar steadied near two-week highs in early European trade Wednesday ahead of the release of the minutes of the Federal Reserve’s December meeting.
Today, the U.S. dollar index measures the Greenback against a trade-weighted basket of six major currencies, which surged 0.11% to 101.999.
The Euro US Dollar (EUR/USD) is a widely traded pair that is down 0.07% today. This left the pair trading around $1.09390.
The Japanese yen was negative against the U.S. dollar on Friday. Today USD/JPY is surged 0.40% to the 142.550 level.
Another commodity-related currency mixed against the U.S dollar, AUD/USD fell 0.10% to 0.67530, and NZD/USD surged 0.11% to 0.62600 level.
EUR/USD Intraday: Resistance level at 1.09660
Preferable Price Action: Take sell positions below pivot level with targets at 1.09330 & 1.09110 in extension.
Alternative Price Action: Above pivot looks for a further upside to 1.09930 & 1.10150.
Comment: RSI is below 50 levels and Pairs below 55MA.
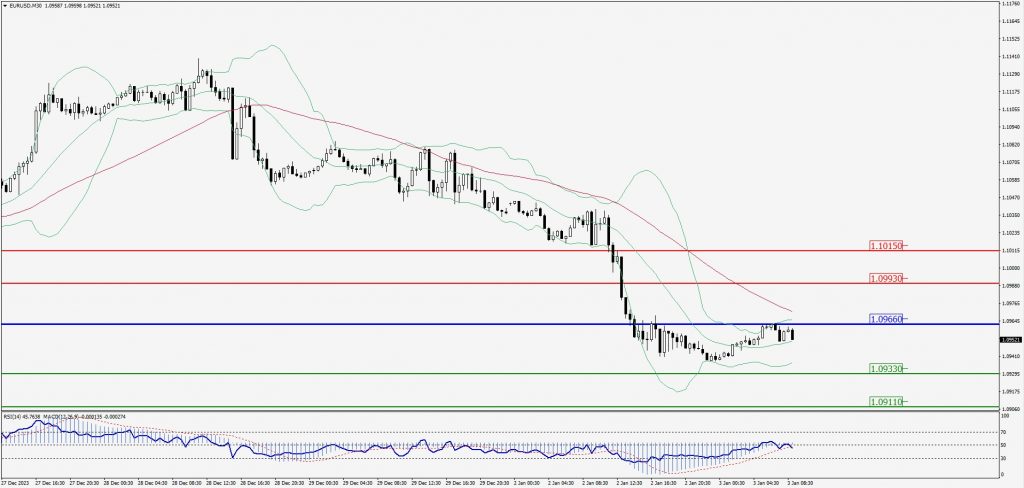
Green Lines Indicate Resistance Levels – Red Lines Indicate Support Levels
Light Blue is a Pivot Point – Black represents the price when the report was produced
GBP/USD Intraday: Trend on the downside
Our pivot point is at 1.26450
Preferable Price Action: Sell positions below pivot with targets at 1.26030 & 1.25820 in extension.
Alternative Price Action: The price above pivot would call for further upside to 1.26710 & 1.26930.
Comment: RSI is below 50 levels and Pairs below 55MA.
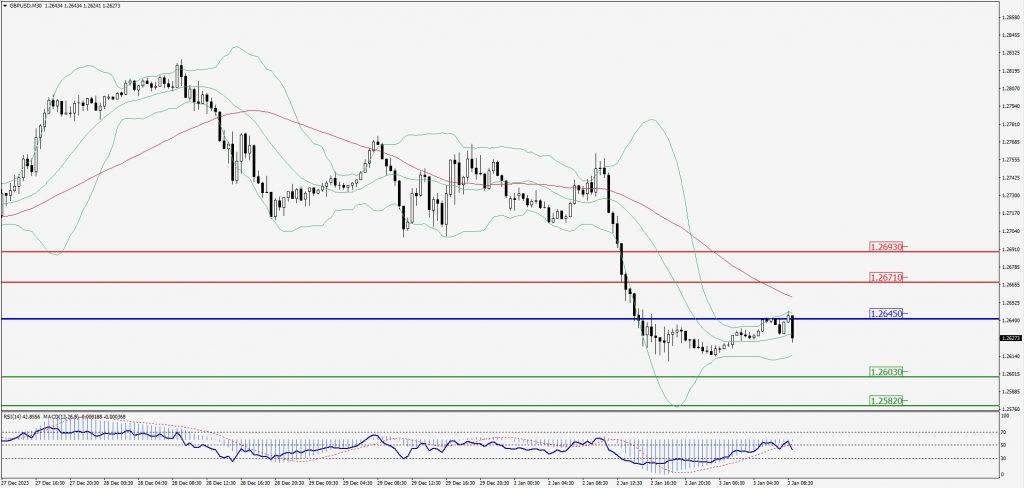
Green Lines Indicate Resistance Levels – Red Lines Indicate Support Levels
Light Blue is a Pivot Point – Black represents the price when the report was produced
USD/JPY Intraday: Trend on the upside
Our pivot point is at 142.270
Preferable Price Action: Buy position above pivot with the target at 142.700 and 143.030 in extension.
Alternative Price Action: The downside breakout of the pivot would call for 141.920 and 141.630.
Comment: MACD is above 50 level and Pairs above its 20MA & 55MA.
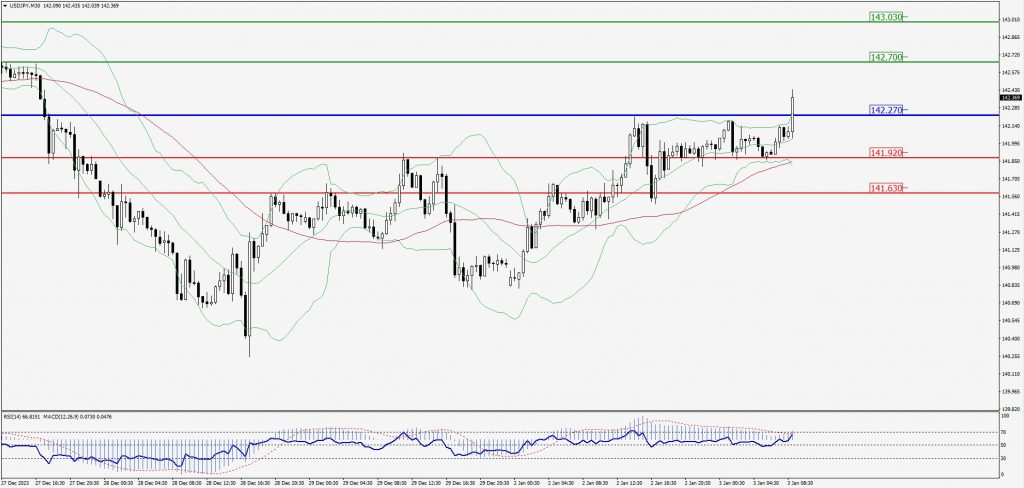
Green Lines Indicate Resistance Levels – Red Lines Indicate Support Levels
Light Blue is a Pivot Point – Black represents the price when the report was produced
AUD/USD Intraday: Trend on the downside
Our pivot point is at 0.67690
Preferable Price Action: Sell positions below pivot with targets at 0.67440 & 0.67280 in extension.
Alternative Price Action: Above pivot looks for a further upside with 0.67910 & 0.68060 as targets.
Comment: RSI is below 50 levels and Pairs below 55MA.
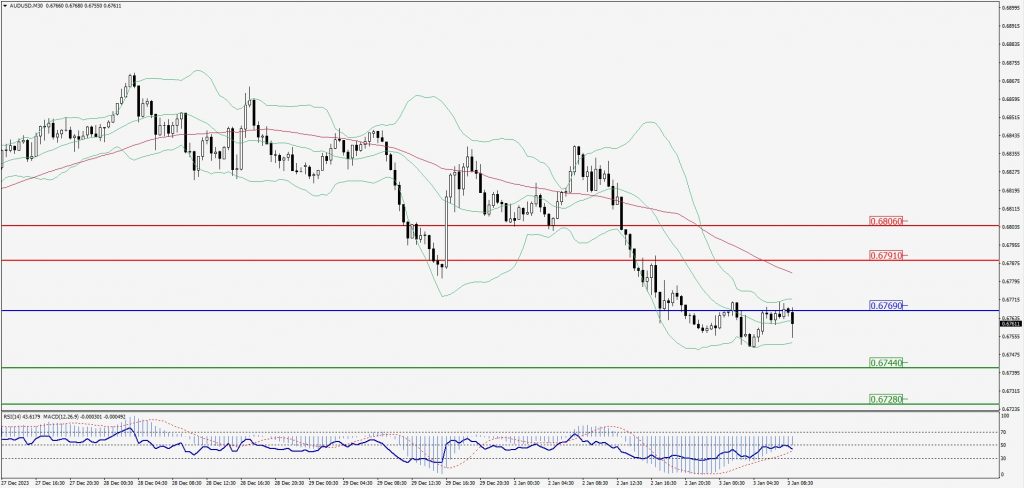
Green Lines Indicate Resistance Levels – Red Lines Indicate Support Levels
Light Blue is a Pivot Point – Black represents the price when the report was produced
CRUDEOIL Intraday: Trend on the downside
Our pivot point is at 70.82
Preferable Price Action: Below pivot sell oil with 69.85 & 69.33 as targets.
Alternative Price Action: Buy crude above pivot with targets at 71.55 and 72.17 in extension.
Comment: MACD is negative territory and Pairs below its 20MA & 55MA.
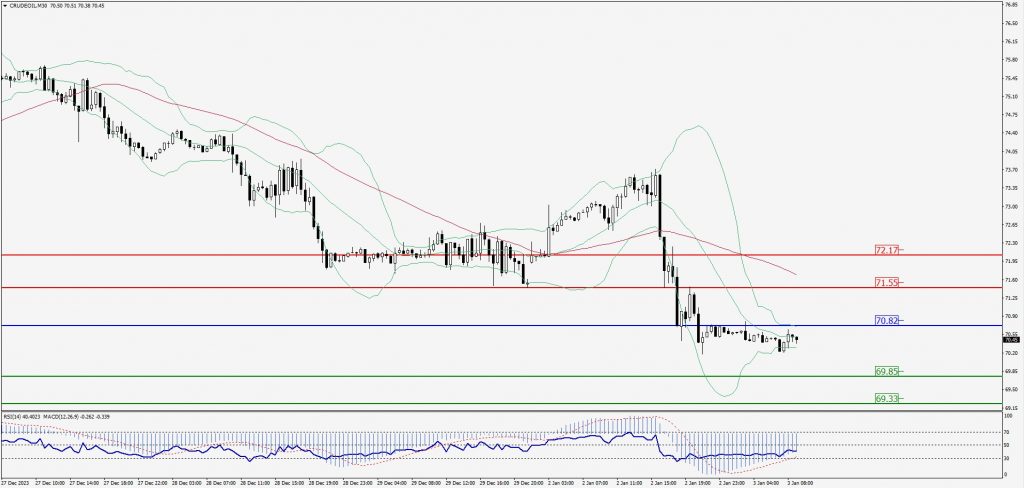
Green Lines Indicate Resistance Levels – Red Lines Indicate Support Levels
Light Blue is a Pivot Point – Black represents the price when the report was produced
XAU/USD Intraday: Trend on the downside
Our pivot point is 2064.00
Preferable Price Action: Further downside to 2059.10 and 2056.30.
Alternative Price Action: If the price gives an upside breakout of a pivot, then the price extends to 2068.20 and 2071.20.
Comment: MACD is below 50 level and Pairs below its 20MA & 55MA.
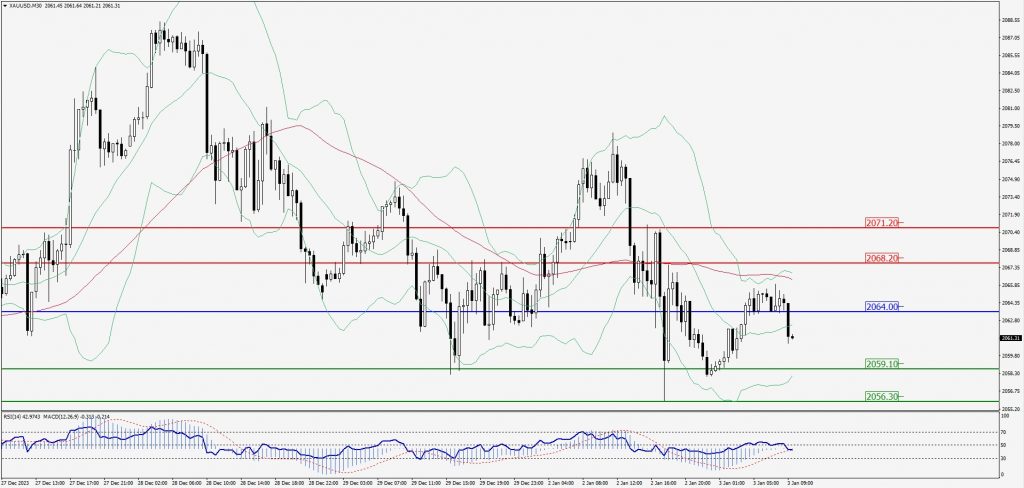
Green Lines Indicate Resistance Levels – Red Lines Indicate Support Levels
Light Blue is a Pivot Point – Black represents the price when the report was produced
Dow Jones Intraday: In a consolidation zone
Our pivot point is 37,716.00
Preferable Price Action: Take sell positions below the pivot with targets at 37,656.00 & 37,620.00.
Alternative Price Action: Above 37,716.00 looks for further upside to 37,767.00 & 37,808.00.
Comment: RSI is below 50 levels and Pairs below 20MA.
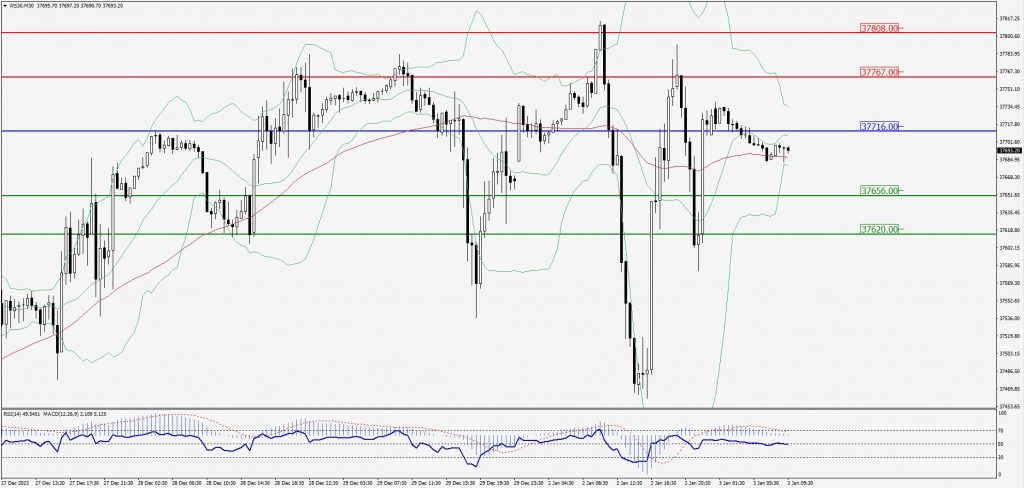
Green Lines Indicate Resistance Levels – Red Lines Indicate Support Levels
Light Blue is a Pivot Point – Black represents the price when the report was produced