Market Wrap: Stocks, Bonds, Commodities
Stocks hit selloff mode Wednesday, and the Nasdaq Composite registered its worst day since February, after Fitch downgraded the long-term rating for the US and risk-off sentiment resurfaced.
The Dow Jones Industrial Average fell 348.16 points to 35,282.52, the S&P 500 lose 1.38% to 4,513.39 and the Nasdaq Composite subtract 310.47 points to 13,973.45.
MSCI’s index of Asia-Pacific stocks outside Japan is drop 0.47% to 646.98 levels. The Australian index was lower by 0.58% to 7,311.70. Japanese Nikkei Index drop 1.61% today.
European stocks were negative on Thursday, with the Stoxx Europe 50 Index fell 0.69% to 4,306.65, Germany’s DAX drop 0.75% to 15,902.05, and France’s CAC decline 0.79% to 7,257.44 and U.K.’s FTSE 100 subtract 1.23% to 7,469.46.
Benchmark 10-year U.S. Treasury fell as demand for safe assets ascend again, today 10-year bond yields positive 1.86% to 4.1500.
Oil prices eased on August 2 after sharp gains, but remained near their highest levels since April, as crude and fuel product inventory data showed robust US demand and offset concerns about the Chinese economy.
Spot Brent crude oil drop 0.24% to $82.99 per barrel. US West Texas Intermediate crude is down 0.23% to $79.30 a barrel.
The yellow metal gold is decline 0.13% to 1,972.45 dollars per ounce.
Market Wrap: Forex
The dollar scaled a four-week peak against major peers on Thursday after upbeat labour market data a day earlier, while sterling edged lower ahead of an expected rate hike from the Bank of England.
Today, the U.S. dollar index measures the Greenback against a trade-weighted basket of six major currencies, which surged 0.05% to 102.440.
The Euro US Dollar (EUR/USD) is a widely traded pair that is up 0.02% today. This left the pair trading around $1.09380.
The Japanese yen was negative against the U.S. dollar on Thursday. Today USD/JPY is slipped 0.29% to the 142.880 level.
Another commodity-related currency negative against the U.S dollar, AUD/USD fell 0.23% to 0.65240, and NZD/USD slipped 0.07% to 0.60750 level.
EUR/USD Intraday: Trend on the downside
Our pivot point is at 1.09410
Preferable Price Action: Take sell positions below pivot level with targets at 1.09010 & 1.08760 in extension.
Alternative Price Action: Above pivot looks for a further upside to 1.09790 & 1.10080.
Comment: RSI is below 50 levels and Pairs below its 20MA & 55MA.
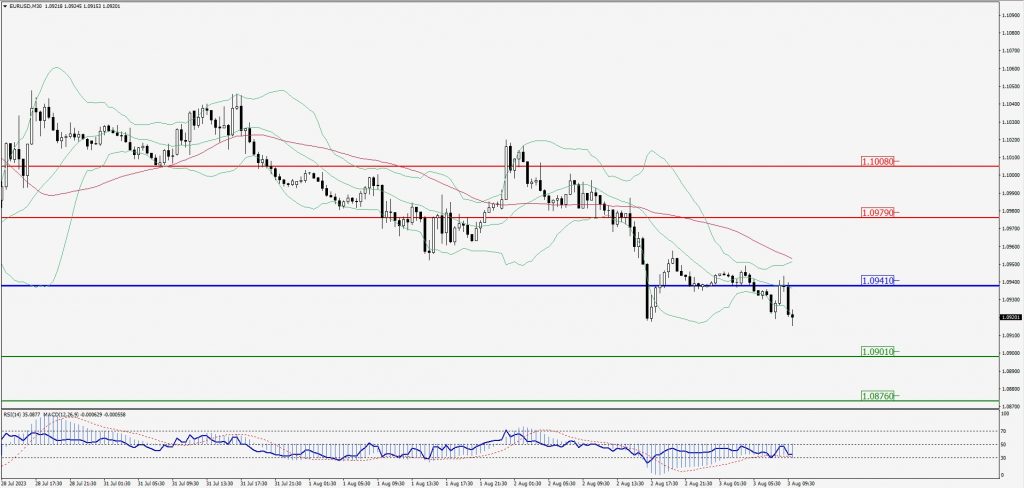
Green Lines Indicate Resistance Levels – Red Lines Indicate Support Levels
Light Blue is a Pivot Point – Black represents the price when the report was produced
GBP/USD Intraday: Resistance level at 1.27230
Our pivot point is at 1.27230
Preferable Price Action: Sell positions below pivot with targets at 1.26620 & 1.26290 in extension.
Alternative Price Action: The price above pivot would call for further upside to 1.27730 & 1.28110.
Comment: RSI is below 50 levels and Pairs below its 20MA & 55MA.
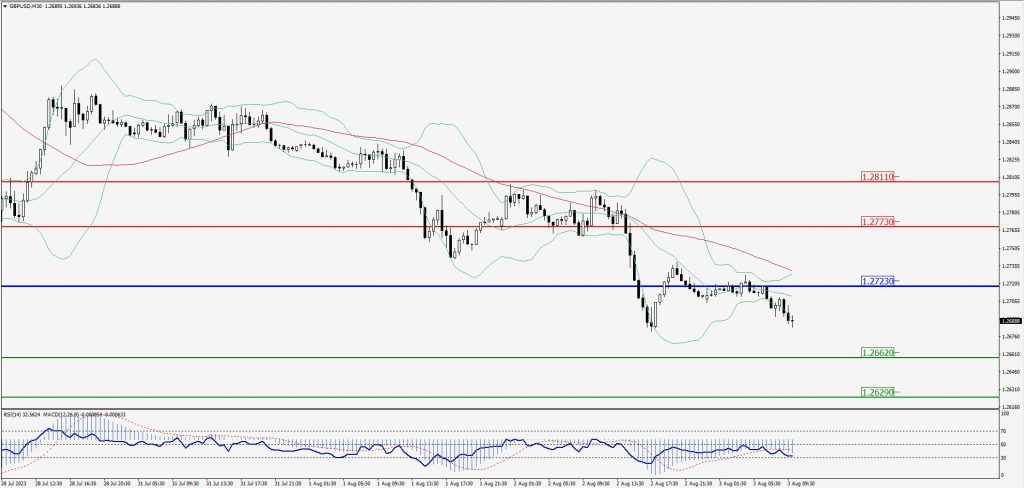
Green Lines Indicate Resistance Levels – Red Lines Indicate Support Levels
Light Blue is a Pivot Point – Black represents the price when the report was produced
USD/JPY Intraday: Support level at 143.310
Our pivot point is at 143.310
Preferable Price Action: Buy position above pivot with the target at 144.150 and 144.740 in extension.
Alternative Price Action: The downside breakout of the pivot would call for 142.600 and 142.060.
Comment: MACD is at 50 level and Pairs above 55MA.
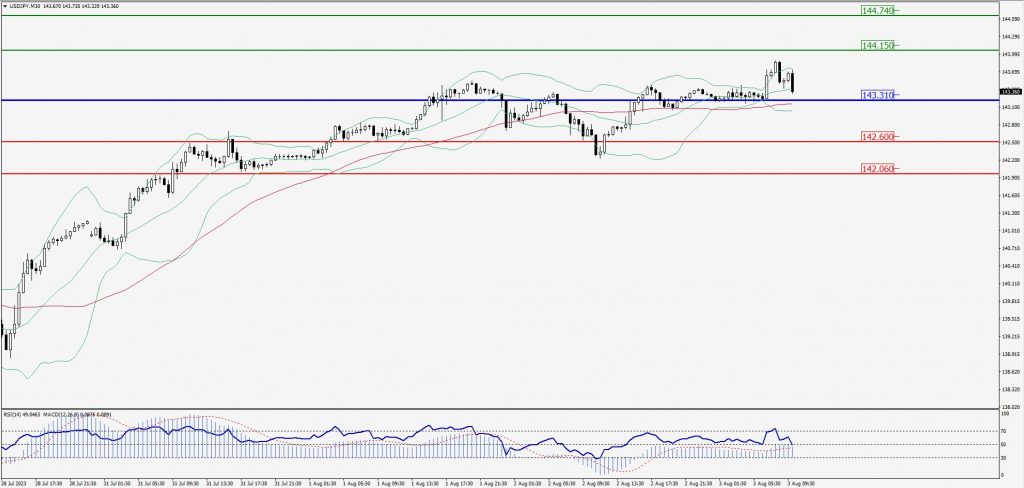
Green Lines Indicate Resistance Levels – Red Lines Indicate Support Levels
Light Blue is a Pivot Point – Black represents the price when the report was produced
AUD/USD Intraday: Trend on the downside
Our pivot point is at 0.65480
Preferable Price Action: Sell positions below pivot with targets at 0.64970 & 0.64630 in extension.
Alternative Price Action: Above pivot looks for a further upside with 0.65940 & 0.66310 as targets.
Comment: RSI is below 50 levels and Pairs below its 20AM & 55MA.
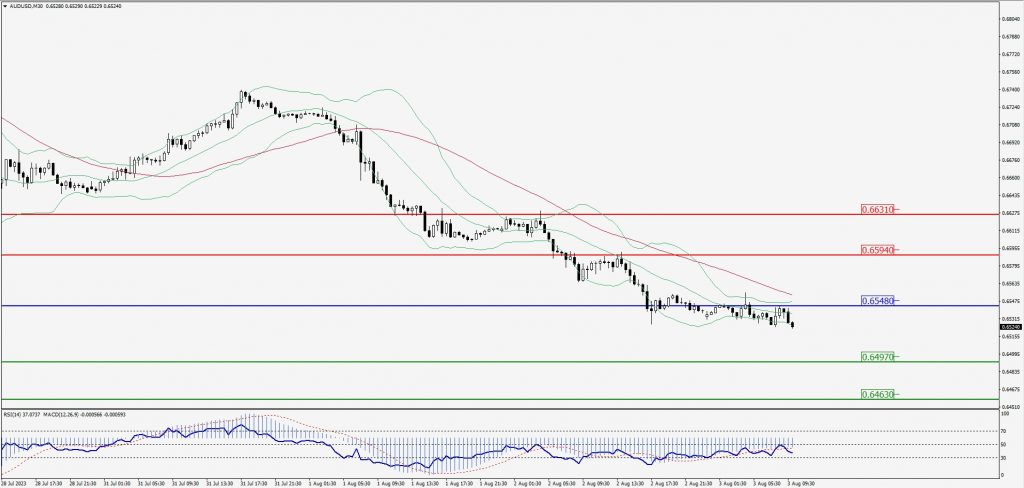
Green Lines Indicate Resistance Levels – Red Lines Indicate Support Levels
Light Blue is a Pivot Point – Black represents the price when the report was produced
CRUDEOIL Intraday: Major trend on the downside
Our pivot point is at 79.33
Preferable Price Action: Below pivot sell oil with 78.35 & 77.74 as targets.
Alternative Price Action: Buy crude above pivot with targets at 80.26 and 80.94 in extension.
Comment: MACD is negative territory and Pairs below its 20MA & 55MA.
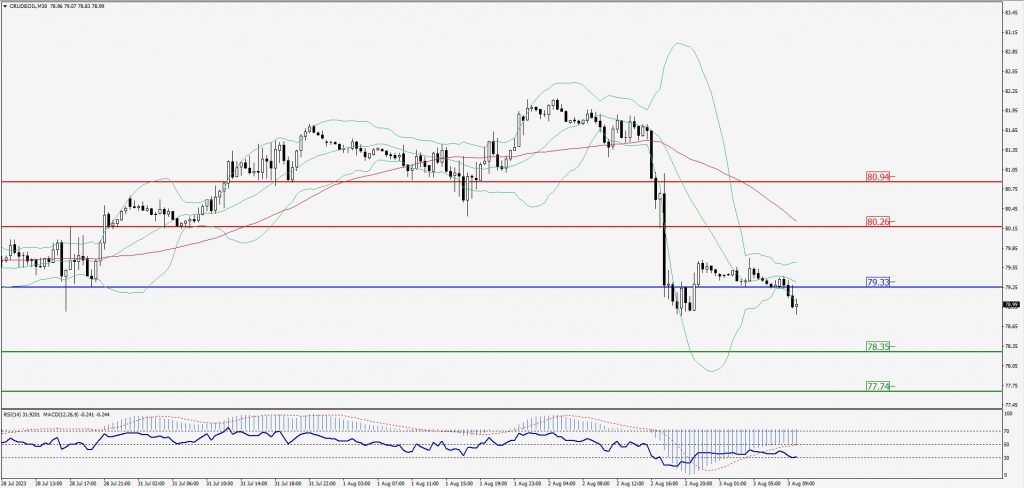
Green Lines Indicate Resistance Levels – Red Lines Indicate Support Levels
Light Blue is a Pivot Point – Black represents the price when the report was produced
XAU/USD Intraday: Trend on the downside
Our pivot point is 1937.50
Preferable Price Action: Further downside to 1926.80 and 1920.80.
Alternative Price Action: If the price gives an upside breakout of a pivot, then the price extends to 1945.90 and 1952.50.
Comment: MACD is below 50 level and Pairs below its 20MA & 55MA.
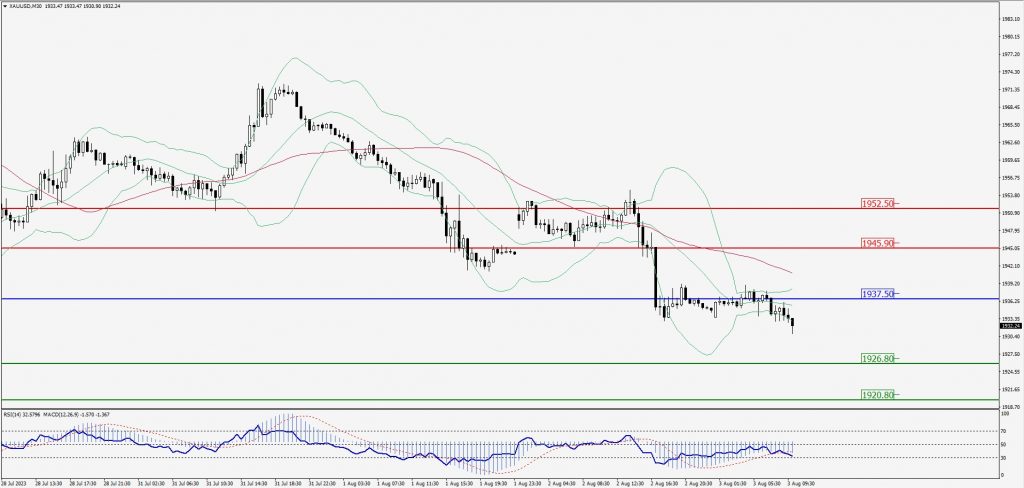
Green Lines Indicate Resistance Levels – Red Lines Indicate Support Levels
Light Blue is a Pivot Point – Black represents the price when the report was produced
Dow Jones Intraday: Major trend on the downside
Our pivot point is 35,282.00
Preferable Price Action: Take sell positions below the pivot with targets at 35,164.00 & 35,092.00.
Alternative Price Action: Above 35,282.00 looks for further upside to 35,388.00 & 35,469.00.
Comment: RSI is below 50 levels and Pairs below its 20MA & 55MA.
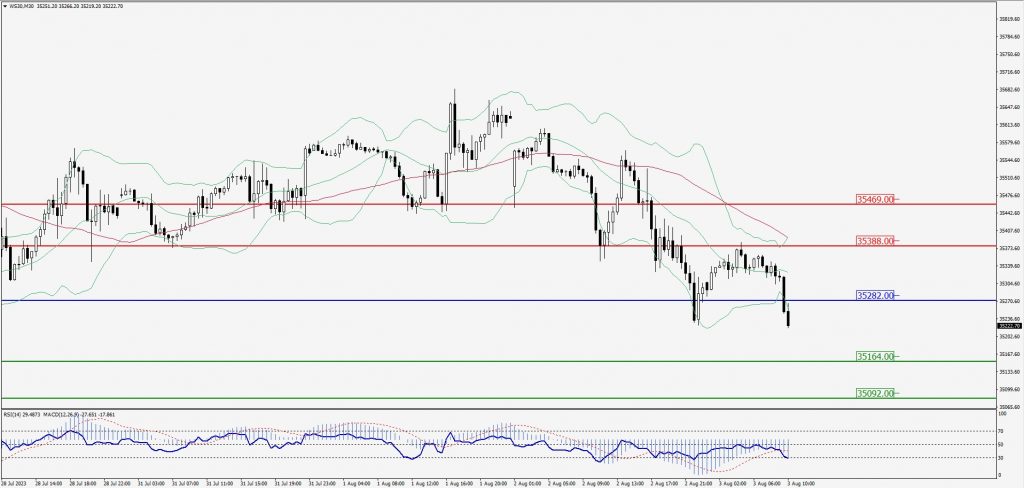
Green Lines Indicate Resistance Levels – Red Lines Indicate Support Levels
Light Blue is a Pivot Point – Black represents the price when the report was produced