Market Wrap: Stocks, Bonds, Commodities
US stock futures fell Tuesday night after Fitch downgraded the United States’ long-term rating and traders continued to assess the latest batch of second-quarter earnings results.
The Dow Jones Industrial Average rose 71.15 points to 35,630.68, the S&P 500 lose 0.27% to 4,576.73 and the Nasdaq Composite subtract 62.11 points to 14,283.91.
MSCI’s index of Asia-Pacific stocks outside Japan is drop 2.10% to 651.17 levels. The Australian index was lower by 1.29% to 7,354.60. Japanese Nikkei Index drop 2.27% today.
European stocks were negative on Wednesday, with the Stoxx Europe 50 Index fell 1.73% to 4,331.95, Germany’s DAX drop 1.73% to 15,958.75, and France’s CAC decline 1.56% to 7,290.37 and U.K.’s FTSE 100 subtract 1.89% to 7,521.24.
Benchmark 10-year U.S. Treasury fell as demand for safe assets ascend again, today 10-year bond yields negative 0.64% to 4.0240.
Oil prices edged lower on Tuesday on signs of profit-taking after rallying in July when investors wagered on tightening global supplies and demand growth in the second half of the year.
Spot Brent crude oil ascend 0.62% to $85.44 per barrel. US West Texas Intermediate crude is up 0.66% to $81.91 a barrel.
The yellow metal gold is advance 0.46% to 1,987.95 dollars per ounce.
Market Wrap: Forex
The U.S. dollar slipped lower in volatile European trade Wednesday, as traders digested Fitch’s downgrade of its U.S. sovereign rating as well as relatively strong economic data.
Today, the U.S. dollar index measures the Greenback against a trade-weighted basket of six major currencies, which slipped 0.13% to 101.950.
The Euro US Dollar (EUR/USD) is a widely traded pair that is up 0.01% today. This left the pair trading around $1.09810.
The Japanese yen was negative against the U.S. dollar on Wednesday. Today USD/JPY is slipped 0.63% to the 142.420 level.
Another commodity-related currency negative against the U.S dollar, AUD/USD fell 0.50% to 0.65780, and NZD/USD slipped 0.66% to 0.61080 level.
EUR/USD Intraday: Support level at 1.09850
Our pivot point is at 1.09850
Preferable Price Action: Take buy positions above pivot level with targets at 1.10330 & 1.10650 in extension.
Alternative Price Action: Below pivot looks for a further downside to 1.09420 & 1.09100.
Comment: RSI is above 50 levels.
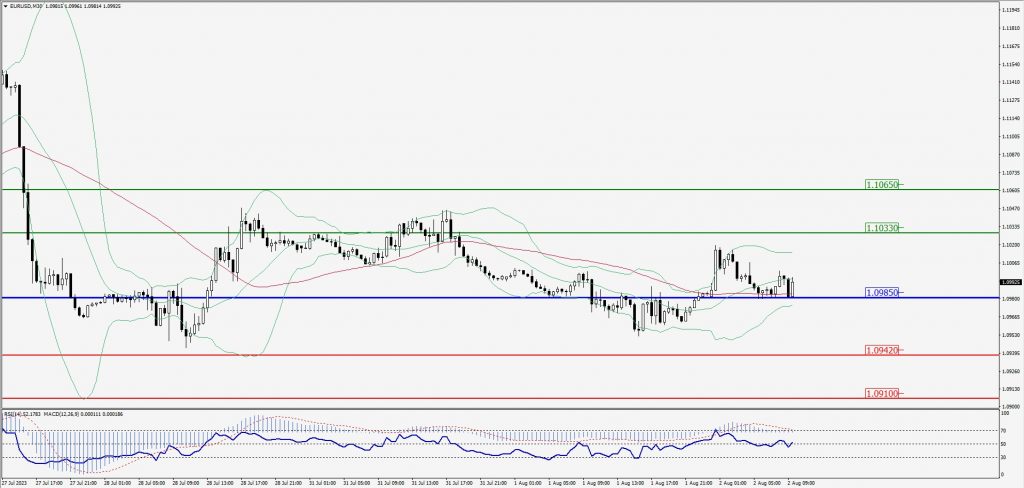
Green Lines Indicate Resistance Levels – Red Lines Indicate Support Levels
Light Blue is a Pivot Point – Black represents the price when the report was produced
GBP/USD Intraday: Resistance level at 1.28010
Our pivot point is at 1.28010
Preferable Price Action: Sell positions below pivot with targets at 1.27290 & 1.26860 in extension.
Alternative Price Action: The price above pivot would call for further upside to 1.28660 & 1.29170.
Comment: RSI is below 50 levels and Pairs below its 20MA & 55MA.
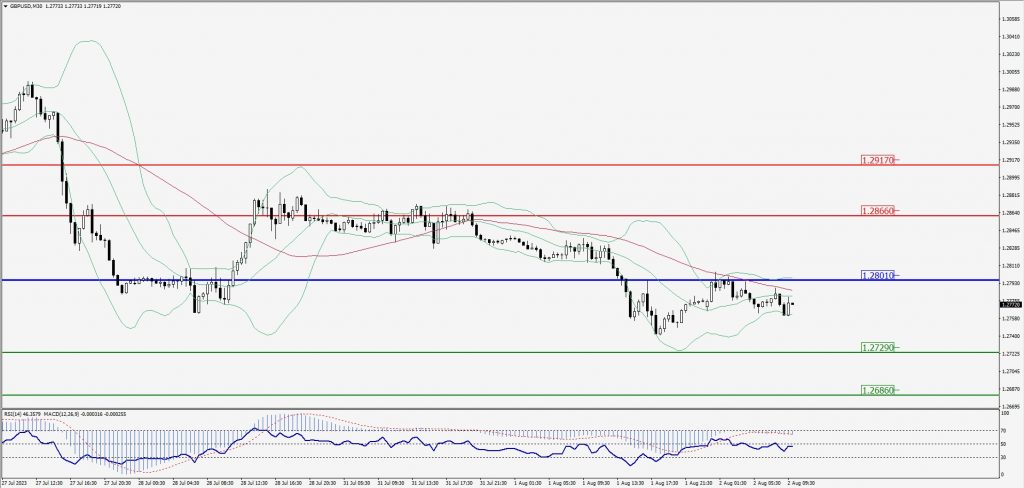
Green Lines Indicate Resistance Levels – Red Lines Indicate Support Levels
Light Blue is a Pivot Point – Black represents the price when the report was produced
USD/JPY Intraday: Trend on the downside
Our pivot point is at 143.260
Preferable Price Action: Sell position below pivot with the target at 142.230 and 141.660 in extension.
Alternative Price Action: The upside breakout of the pivot would call for 144.060 and 144.690.
Comment: MACD is below 50 level and Pairs above its 20MA & 55MA.
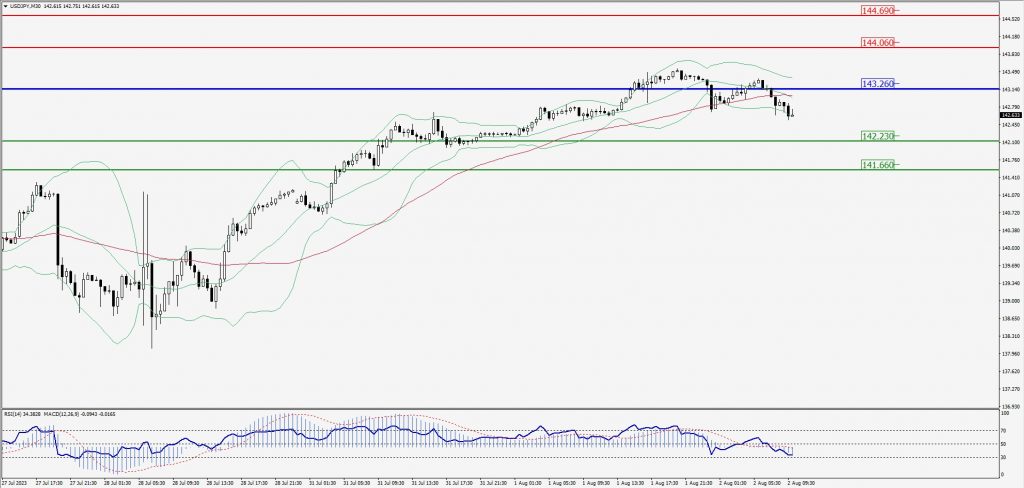
Green Lines Indicate Resistance Levels – Red Lines Indicate Support Levels
Light Blue is a Pivot Point – Black represents the price when the report was produced
AUD/USD Intraday: Major trend on the downside
Our pivot point is at 0.66000
Preferable Price Action: Sell positions below pivot with targets at 0.65430 & 0.65040 in extension.
Alternative Price Action: Above pivot looks for a further upside with 0.66480 & 0.66860 as targets.
Comment: RSI is below 50 levels and Pairs below its 20AM & 55MA.
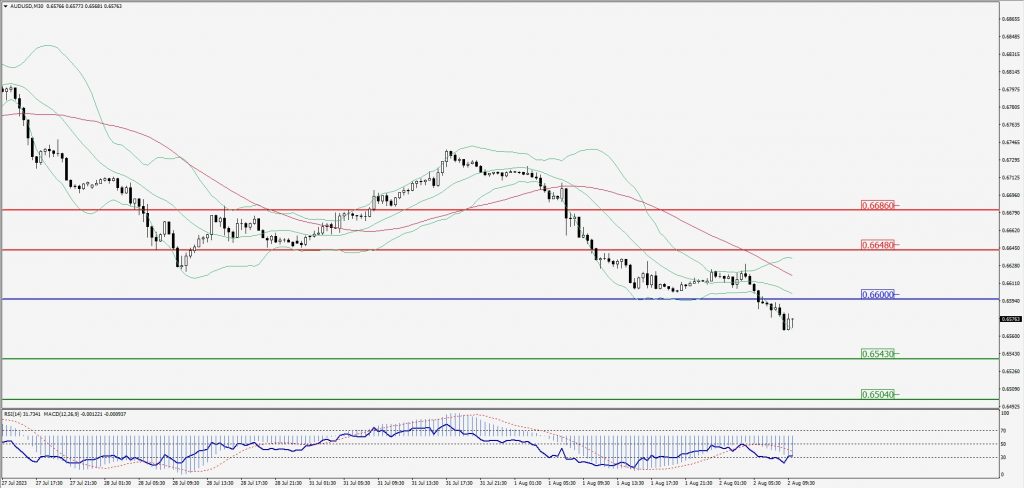
Green Lines Indicate Resistance Levels – Red Lines Indicate Support Levels
Light Blue is a Pivot Point – Black represents the price when the report was produced
CRUDEOIL Intraday: Trend on the upside
Our pivot point is at 81.59
Preferable Price Action: Above pivot buy oil with 82.35 & 82.86 as targets.
Alternative Price Action: Sell crude below pivot with targets at 80.93 and 80.43 in extension.
Comment: MACD is positive territory and Pairs above 55MA.
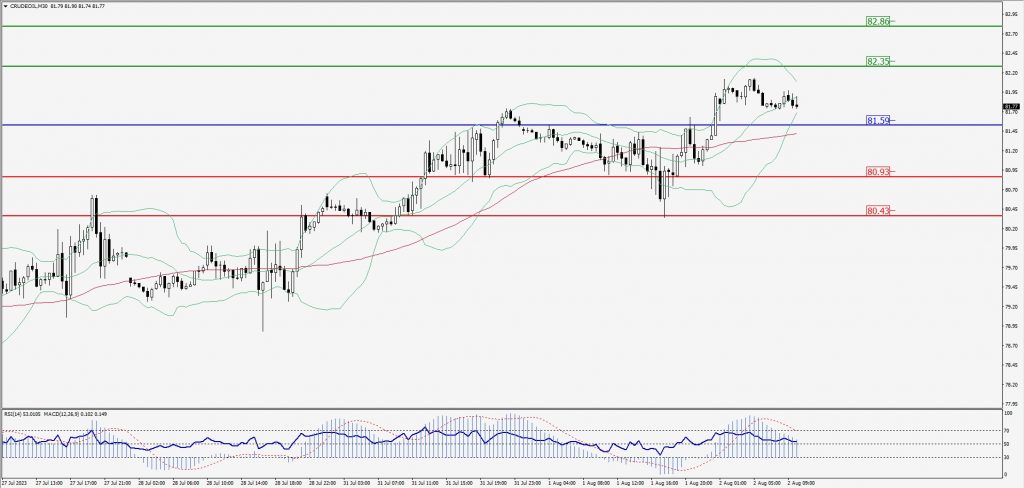
Green Lines Indicate Resistance Levels – Red Lines Indicate Support Levels
Light Blue is a Pivot Point – Black represents the price when the report was produced
XAU/USD Intraday: Trend on the upside
Our pivot point is 1948.10
Preferable Price Action: Further upside to 1957.40 and 1962.60.
Alternative Price Action: If the price gives a downside breakout of a pivot, then the price extends to 1940.70 and 1935.80.
Comment: MACD is above 50 level and Pairs above 20MA.
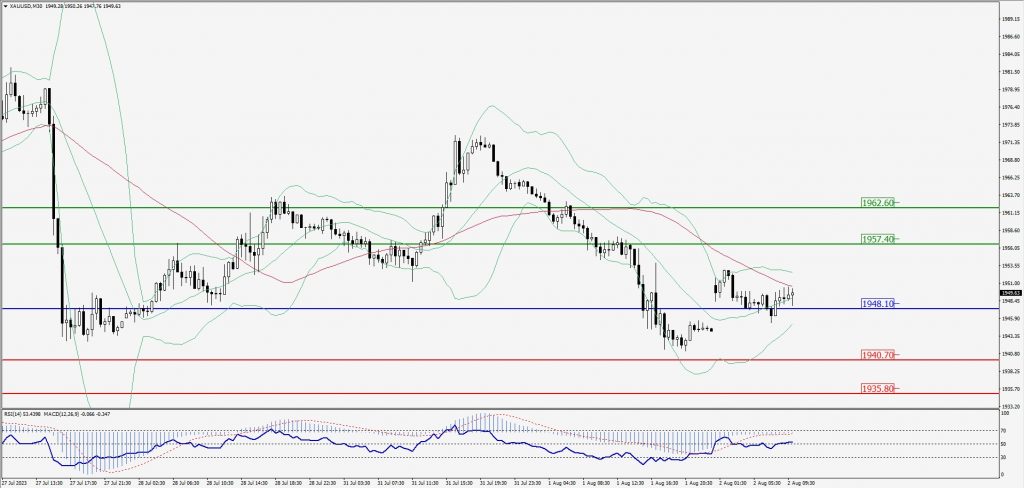
Green Lines Indicate Resistance Levels – Red Lines Indicate Support Levels
Light Blue is a Pivot Point – Black represents the price when the report was produced
Dow Jones Intraday: Trend on the downside
Our pivot point is 35,536.00
Preferable Price Action: Take sell positions below the pivot with targets at 35,427.00 & 35,355.00.
Alternative Price Action: Above 35,536.00 looks for further upside to 35,627.00 & 35,712.00.
Comment: RSI is below 50 levels and Pairs below its 20MA & 55MA.
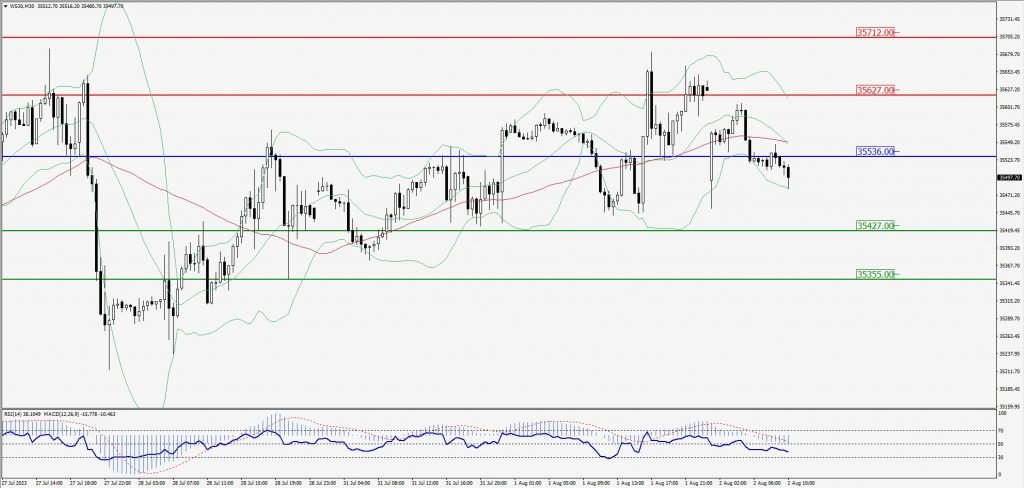
Green Lines Indicate Resistance Levels – Red Lines Indicate Support Levels
Light Blue is a Pivot Point – Black represents the price when the report was produced