Market Wrap: Stocks, Bonds, Commodities
Wall Street’s main indexes notched record closing highs on November 1 as Tesla shares surged and the energy sector gained while investors looked ahead to a major Federal Reserve meeting later in the week.
The Dow Jones Industrial Average advance 94.28 points (0.26%) to 35,913.84, the S&P 500 rose 8.29 points (0.18%) to 4,613.67 and the Nasdaq Composite gained 97.53 points (0.63%) to 15,595.92.
MSCI’s index of Asia-Pacific stocks outside Japan is rose 0.05% to 811.41 levels. Australian index fell 0.63% to 7,324.30. Japanese Nikkei Index lost 0.43% to 29,520.00.
European stocks were mixed on Tuesday, with the Stoxx Europe 50 Index flat to 4,281.50, Germany’s DAX rose 0.30% to 15,856.85, and France’s CAC flat to 6,895.30, and U.K.’s FTSE 100 down 0.49% to 7,2352.70.
Benchmark 10-year U.S. Treasury rose as demand for safe assets grows again, today 10-year bond yields rose 0.55% to 1.564.
Oil prices rose on November 2 as key producer group OPEC undershot its expected pace of output increases last month, while the world’s top oil consumer China ramped up operating rates to meet a spike in diesel demand.
Spot Brent crude oil fell 0.41% to $83.38 per barrel. US West Texas Intermediate crude slipped 0.59% to $83.08 a barrel.
The yellow metal traded 0.05% lower to 1783.30 dollars per ounce.
Market Wrap: Forex
The dollar gained to major peers on Monday as quickening inflation in the United States boosted the case for earlier Federal Reserve interest rate hikes ahead of a policy decision on Wednesday.
Today, the U.S. dollar index measures the greenback against a trade-weighted basket of six major currencies, which gained 0.10% to 93.895.
The Euro US Dollar (EUR/USD) is a widely traded pair that is fell 0.05% today. This left the pairing trading around $1.155990.
The Japanese yen rose against the U.S. dollar on Tuesday as the stock pushes lower. Today US/JPY is fell 0.37% to 113.590 level.
Another commodity-related currency lower against the U.S dollar, AUD/USD lost 0.70% to 0.74690, and NZD/USD down 0.10% to 0.71720 level.
EUR/USD Intraday: Trend on the upside
Our pivot point is at 1.15790
Preferable Price Action: Take long positions above pivot level with targets at 1.16410 & 1.16800 in extension.
Alternative Price Action: Below pivot looks for a further downside to 1.15230 & 1.14900.
Comment: Pair above its 55MA & 20MA and RSI above 50 levels.
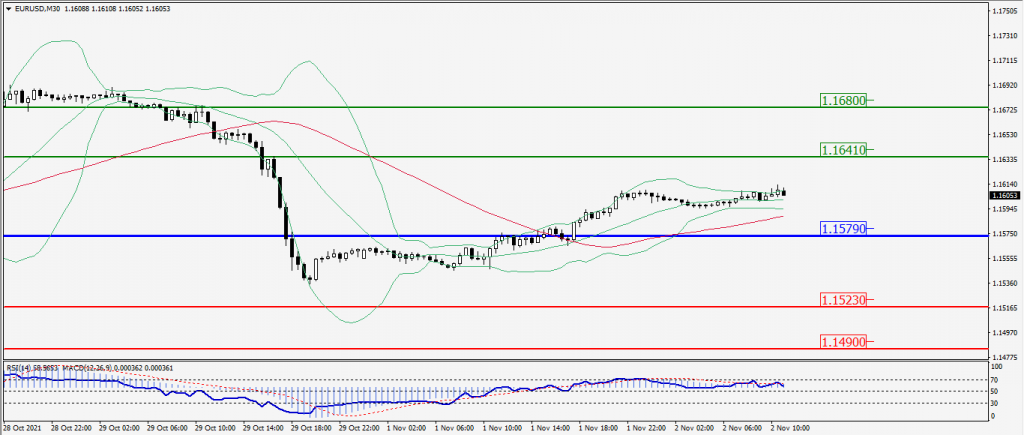
Green Lines Indicate Resistance Levels – Red Lines Indicates Support Levels
Light Blue is a Pivot Point – Black represents the price when the report was produced
GBP/USD Intraday: Resistance at 1.37050
Our pivot point is at 1.37050
Preferable Price Action: Sell positions below pivot with targets at 1.36250 & 1.35860 in extension.
Alternative Price Action: The price above pivot would call for further upside to 1.37810 & 1.38210.
Comment: Pair below its 50MA & 20MA and RSI below 50 levels.
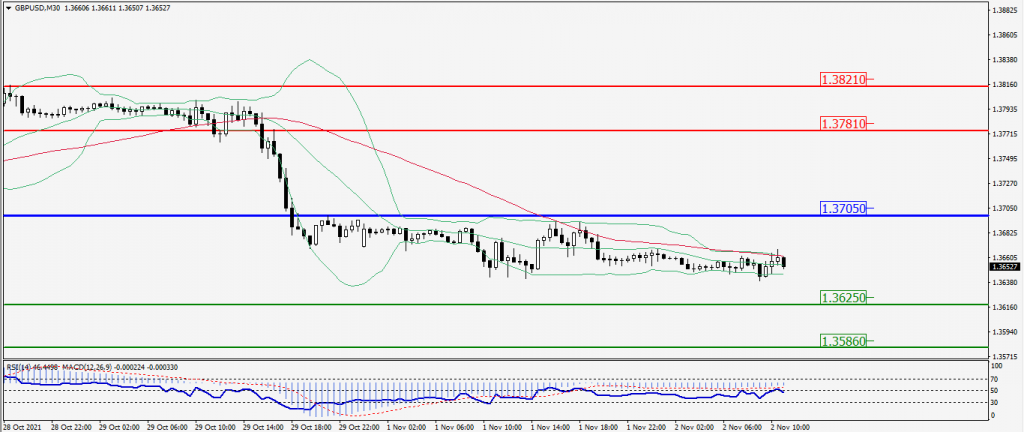
Green Lines Indicate Resistance Levels – Red Lines Indicates Support Levels
Light Blue is a Pivot Point – Black represents the price when the report was produced
USD/JPY Intraday: Break support level
Our pivot point is at 114.030
Preferable Price Action: Sell position below pivot with the target at 113.480 and 113.190 in extension.
Alternative Price Action: The upside breakout of the pivot would call for 114.510 and 114.800.
Comment: Price below its 55MA & 20MA and MACD in negative territory.
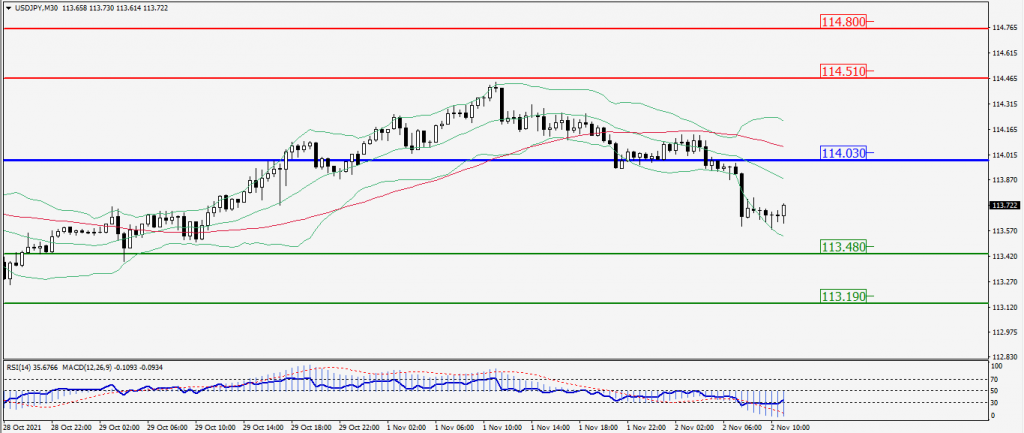
Green Lines Indicate Resistance Levels – Red Lines Indicates Support Levels
Light Blue is a Pivot Point – Black represents the price when the report was produced
AUD/USD Intraday: Break support level
Our pivot point is at 0.75180
Preferable Price Action: Sell Positions below pivot with targets at 0.74610 & 0.74290 in extension.
Alternative Price Action: Above pivot looks for a further upside with 0.75770 & 0.76120 as targets.
Comment: Pair below its 55MA & 20MA and RSI below 50 levels.
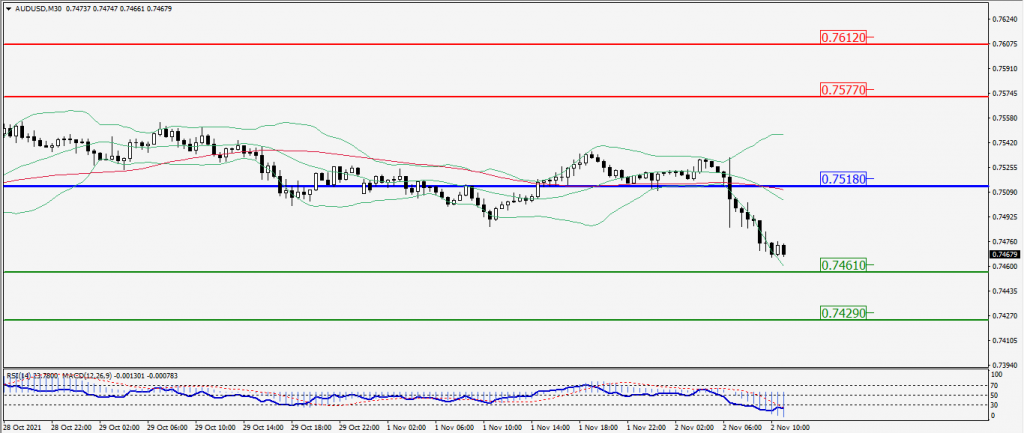
Green Lines Indicate Resistance Levels – Red Lines Indicates Support Levels
Light Blue is a Pivot Point – Black represents the price when the report was produced
CRUDEOIL Intraday: Support at 82.70
Our pivot point is at 82.70
Preferable Price Action: Above pivots buy Oil with 85.00 & 86.10 as targets.
Alternative Price Action: Sell crude below pivot with targets at 80.60 and 79.20 in extension.
Comment: Crude is above its 55MA & 20MA and MACD in the positive territory.
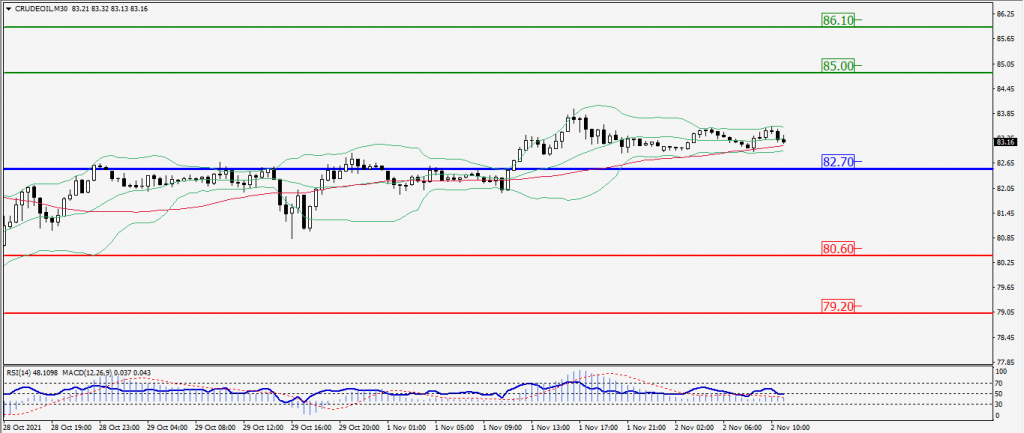
Green Lines Indicate Resistance Levels – Red Lines Indicates Support Levels
Light Blue is a Pivot Point – Black represents the price when the report was produced
XAU/USD Intraday: Trend on the upside
Our pivot point is 1790.30
Preferable Price Action: Further Upside to 1807.50 and 1816.80
Alternative Price Action: If the price gives a Downside breakout of a pivot, then the price extends to 1775.90 and 1766.80.
Comment: MACD in flat territory and price above its 55MA.
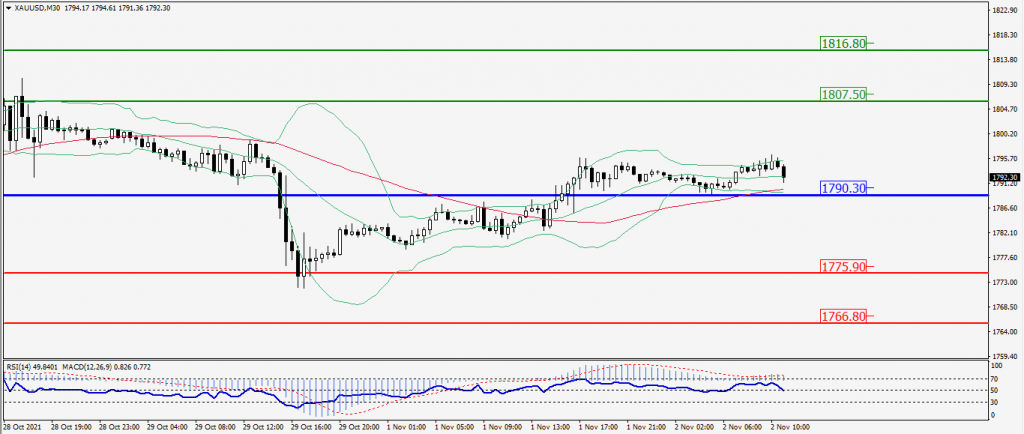
Green Lines Indicate Resistance Levels – Red Lines Indicates Support Levels
Light Blue is a Pivot Point – Black represents the price when the report was produced
Dow Jones Intraday: Support at 35,790.00
Our pivot point is 35,790.00
Preferable Price Action: Take long positions above pivot with targets at 35,970.00 & 36,060.00.
Alternative Price Action: Below 35,790.00 looks for further downside to 35,610.00 & 35,510.00.
Comment: Price above its 55MA and RSI above 50 levels.
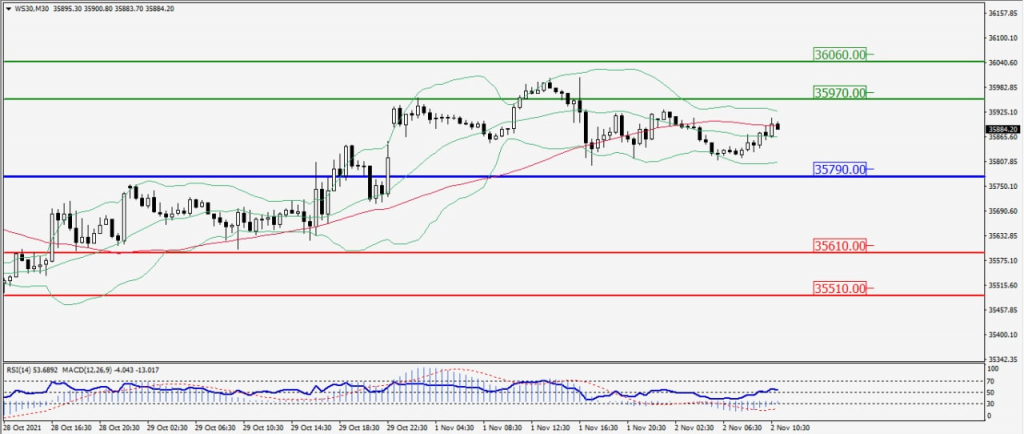
Green Lines Indicate Resistance Levels – Red Lines Indicates Support Levels
Light Blue is a Pivot Point – Black represents the price when the report was produced